29
/
en
AIzaSyAYiBZKx7MnpbEhh9jyipgxe19OcubqV5w
April 1, 2024
187773
Malaysia
MYS
true
2
1
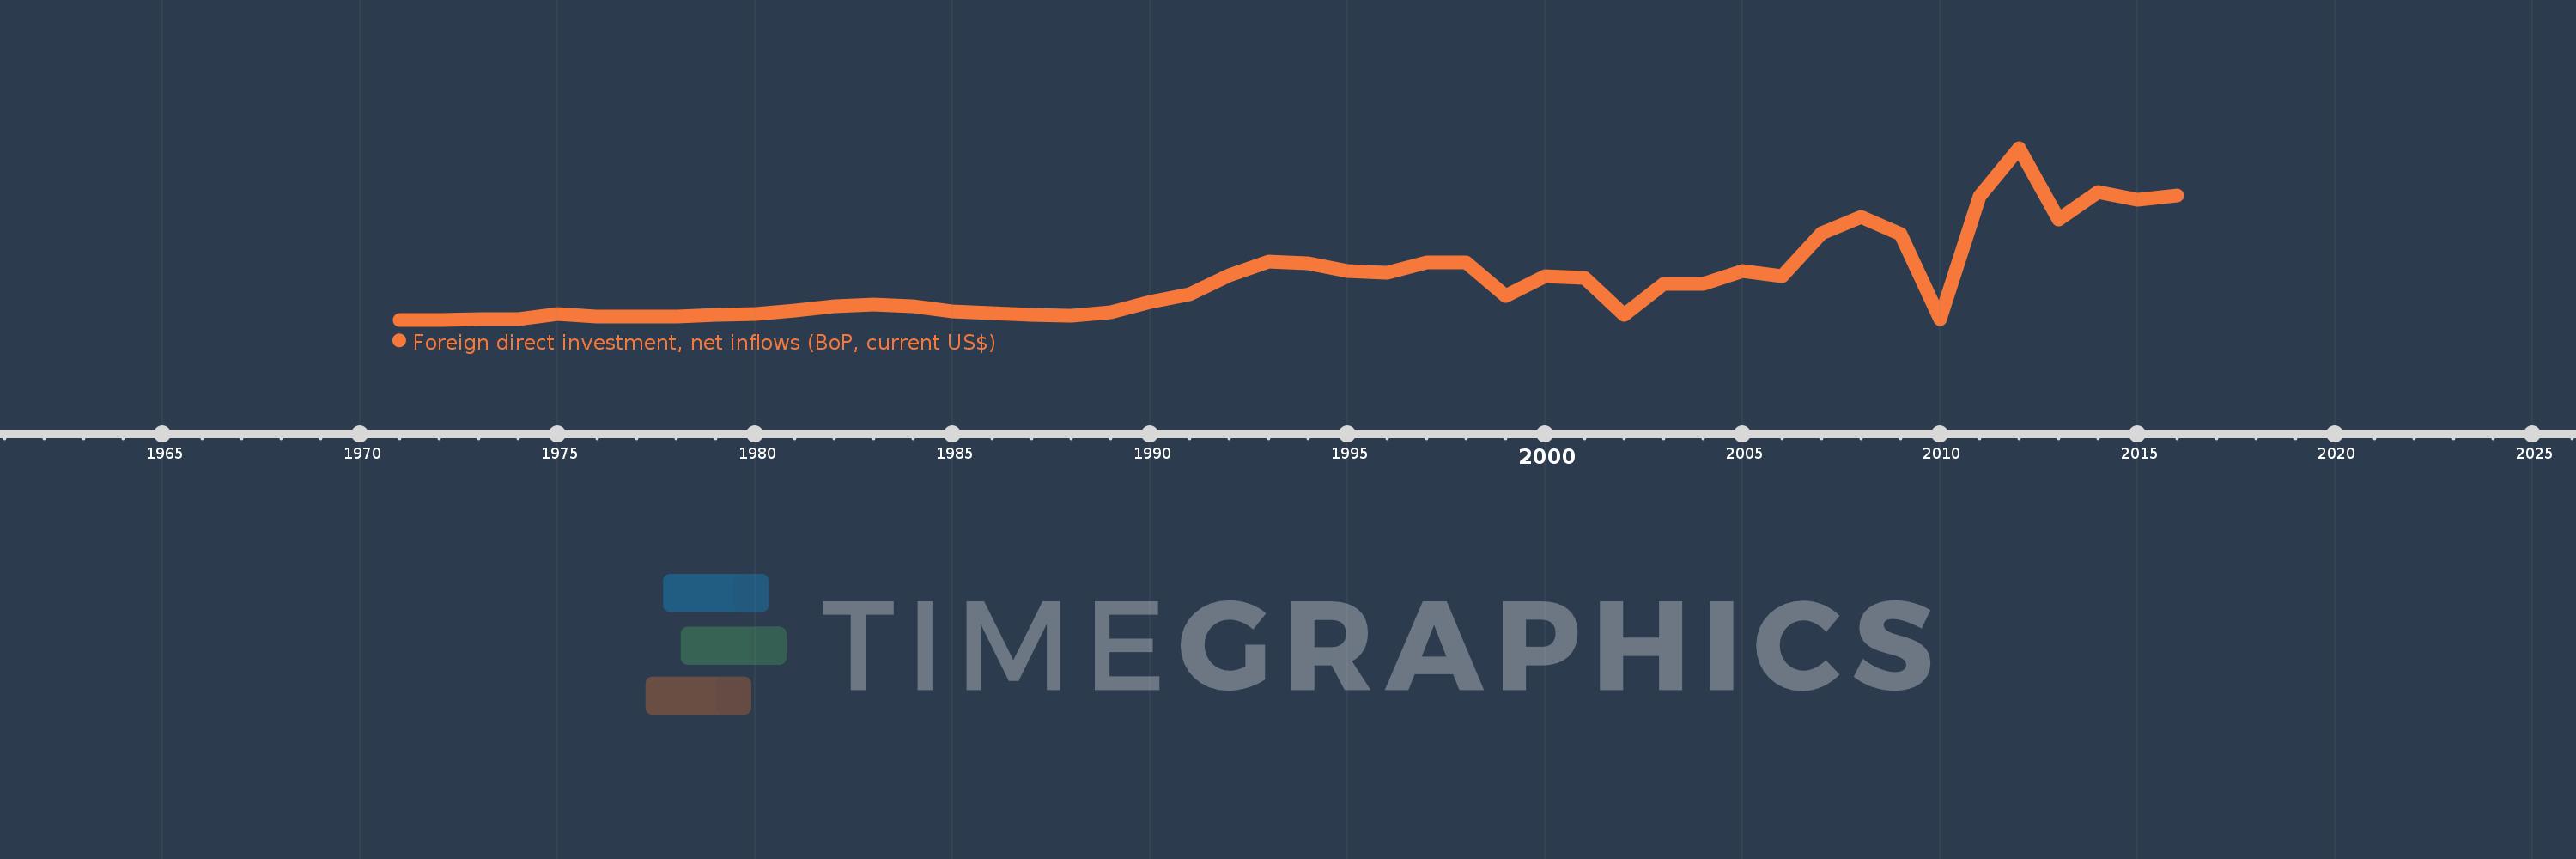
Foreign direct investment, net inflows (BoP, current US$)
2016,2015,2014,2013,2012,2011,2010,2009,2008,2007,2006,2005,2004,2003,2002,2001,2000,1999,1998,1997,1996,1995,1994,1993,1992,1991,1990,1989,1988,1987,1986,1985,1984,1983,1982,1981,1980,1979,1978,1977,1976,1975,1974,1973,1972,1971
This statistics in other country:
AfghanistanAlbaniaAlgeriaAngolaAntigua and BarbudaArab WorldArgentinaArmeniaArubaAustraliaAustriaAzerbaijanBahamas, TheBahrainBangladeshBarbadosBelarusBelgiumBelizeBeninBermudaBhutanBoliviaBosnia and HerzegovinaBotswanaBrazilBritish Virgin IslandsBrunei DarussalamBulgariaBurkina FasoBurundiCabo VerdeCambodiaCameroonCanadaCaribbean small statesCayman IslandsCentral African RepublicCentral Europe and the BalticsChadChileChinaColombiaComorosCongo, Dem. Rep.Congo, Rep.Costa RicaCote d'IvoireCroatiaCuracaoCyprusCzech RepublicDenmarkDjiboutiDominicaDominican RepublicEarly-demographic dividendEast Asia & PacificEast Asia & Pacific (excluding high income)East Asia & Pacific (IDA & IBRD countries)EcuadorEgypt, Arab Rep.El SalvadorEquatorial GuineaEritreaEstoniaEthiopiaEuro areaEurope & Central AsiaEurope & Central Asia (excluding high income)Europe & Central Asia (IDA & IBRD countries)European UnionFijiFinlandFragile and conflict affected situationsFranceFrench PolynesiaGabonGambia, TheGeorgiaGermanyGhanaGibraltarGreeceGrenadaGuatemalaGuineaGuinea-BissauGuyanaHaitiHeavily indebted poor countries (HIPC)High incomeHondurasHong Kong SAR, ChinaHungaryIBRD onlyIcelandIDA & IBRD totalIDA blendIDA onlyIDA totalIndiaIndonesiaIran, Islamic Rep.IraqIrelandIsraelItalyJamaicaJapanJordanKazakhstanKenyaKiribatiKorea, Dem. People’s Rep.Korea, Rep.KosovoKuwaitKyrgyz RepublicLao PDRLate-demographic dividendLatin America & Caribbean Latin America & Caribbean (excluding high income)Latin America & the Caribbean (IDA & IBRD countries)LatviaLeast developed countries: UN classificationLebanonLesothoLiberiaLibyaLithuaniaLow & middle incomeLow incomeLower middle incomeLuxembourgMacao SAR, ChinaMacedonia, FYRMadagascarMalawiMalaysiaMaldivesMaliMaltaMarshall IslandsMauritaniaMauritiusMexicoMicronesia, Fed. Sts.Middle East & North AfricaMiddle East & North Africa (excluding high income)Middle East & North Africa (IDA & IBRD countries)Middle incomeMoldovaMongoliaMontenegroMoroccoMozambiqueMyanmarNamibiaNauruNepalNetherlandsNew CaledoniaNew ZealandNicaraguaNigerNigeriaNorth AmericaNorthern Mariana IslandsNorwayOECD membersOmanOther small statesPacific island small statesPakistanPalauPanamaPapua New GuineaParaguayPeruPhilippinesPolandPortugalPost-demographic dividendPre-demographic dividendQatarRomaniaRussian FederationRwandaSamoaSao Tome and PrincipeSaudi ArabiaSenegalSerbiaSeychellesSierra LeoneSingaporeSint Maarten (Dutch part)Slovak RepublicSloveniaSmall statesSolomon IslandsSomaliaSouth AfricaSouth AsiaSouth Asia (IDA & IBRD)South SudanSpainSri LankaSt. Kitts and NevisSt. LuciaSt. Vincent and the GrenadinesSub-Saharan Africa Sub-Saharan Africa (excluding high income)Sub-Saharan Africa (IDA & IBRD countries)SudanSurinameSwazilandSwedenSwitzerlandSyrian Arab RepublicTajikistanTanzaniaThailandTimor-LesteTogoTongaTrinidad and TobagoTunisiaTurkeyTurkmenistanTuvaluUgandaUkraineUnited Arab EmiratesUnited KingdomUnited StatesUpper middle incomeUruguayUzbekistanVanuatuVenezuela, RBVietnamWest Bank and GazaWorldYemen, Rep.ZambiaZimbabwe Timeline:
This timeline shows a graph from 1971 to 2016 of Malaysia. No data until 1970. Number of actual observations by date: 46.
Source name:
World Development Indicators
Source organization:
International Monetary Fund, Balance of Payments database, supplemented by data from the United Nations Conference on Trade and Development and official national sources.
Categories, topics:
Economy & Growth, Financial Sector, External Debt
Last updated:
apr 23, 2017
Indicators value changes by year
Minimum:
94.0 mln
jan 1, 1971
Maximum:
15.119 bln
jan 1, 2012
At the date of observation
Value
Absolute change
Change from previous value
jan 1, 1971
94.0 mln
+94.0 mln
0.0%
jan 1, 1972
100.0 mln
+6.0 mln
6.38%
jan 1, 1973
114.0 mln
+14.0 mln
14.0%
jan 1, 1974
172.0 mln
+58.0 mln
50.88%
jan 1, 1975
570.819 mln
+398.819 mln
231.87%
jan 1, 1976
350.491 mln
-220.328 mln
-38.6%
jan 1, 1977
381.26 mln
+30.768 mln
8.78%
jan 1, 1978
405.886 mln
+24.626 mln
6.46%
jan 1, 1979
499.991 mln
+94.105 mln
23.19%
jan 1, 1980
573.467 mln
+73.476 mln
14.7%
jan 1, 1981
933.904 mln
+360.437 mln
62.85%
jan 1, 1982
1.265 bln
+330.784 mln
35.42%
jan 1, 1983
1.397 bln
+132.508 mln
10.48%
jan 1, 1984
1.261 bln
-136.668 mln
-9.78%
jan 1, 1985
797.477 mln
-463.051 mln
-36.73%
jan 1, 1986
694.712 mln
-102.764 mln
-12.89%
jan 1, 1987
488.874 mln
-205.838 mln
-29.63%
jan 1, 1988
422.68 mln
-66.194 mln
-13.54%
jan 1, 1989
719.418 mln
+296.738 mln
70.2%
jan 1, 1990
1.668 bln
+948.454 mln
131.84%
jan 1, 1991
2.332 bln
+664.584 mln
39.85%
jan 1, 1992
3.998 bln
+1.666 bln
71.43%
jan 1, 1993
5.183 bln
+1.185 bln
29.63%
jan 1, 1994
5.006 bln
-177.715 mln
-3.43%
jan 1, 1995
4.342 bln
-663.842 mln
-13.26%
jan 1, 1996
4.178 bln
-163.562 mln
-3.77%
jan 1, 1997
5.078 bln
+900.176 mln
21.54%
jan 1, 1998
5.137 bln
+58.1 mln
1.14%
jan 1, 1999
2.163 bln
-2.973 bln
-57.88%
jan 1, 2000
3.895 bln
+1.732 bln
80.05%
jan 1, 2001
3.788 bln
-107.632 mln
-2.76%
jan 1, 2002
553.947 mln
-3.234 bln
-85.37%
jan 1, 2003
3.193 bln
+2.639 bln
476.39%
jan 1, 2004
3.219 bln
+26.053 mln
0.82%
jan 1, 2005
4.376 bln
+1.157 bln
35.95%
jan 1, 2006
3.925 bln
-451.266 mln
-10.31%
jan 1, 2007
7.691 bln
+3.766 bln
95.95%
jan 1, 2008
9.071 bln
+1.381 bln
17.95%
jan 1, 2009
7.573 bln
-1.499 bln
-16.52%
jan 1, 2010
114.664 mln
-7.458 bln
-98.49%
jan 1, 2011
10.886 bln
+10.771 bln
9.39K%
jan 1, 2012
15.119 bln
+4.234 bln
38.89%
jan 1, 2013
8.896 bln
-6.224 bln
-41.16%
jan 1, 2014
11.296 bln
+2.401 bln
26.98%
jan 1, 2015
10.619 bln
-676.847 mln
-5.99%
jan 1, 2016
10.963 bln
+343.29 mln
3.23%
Ranking of countries by current statistics by years


Comments: