29
/
en
AIzaSyAYiBZKx7MnpbEhh9jyipgxe19OcubqV5w
April 1, 2024
277655
Uruguay
URY
true
2
1
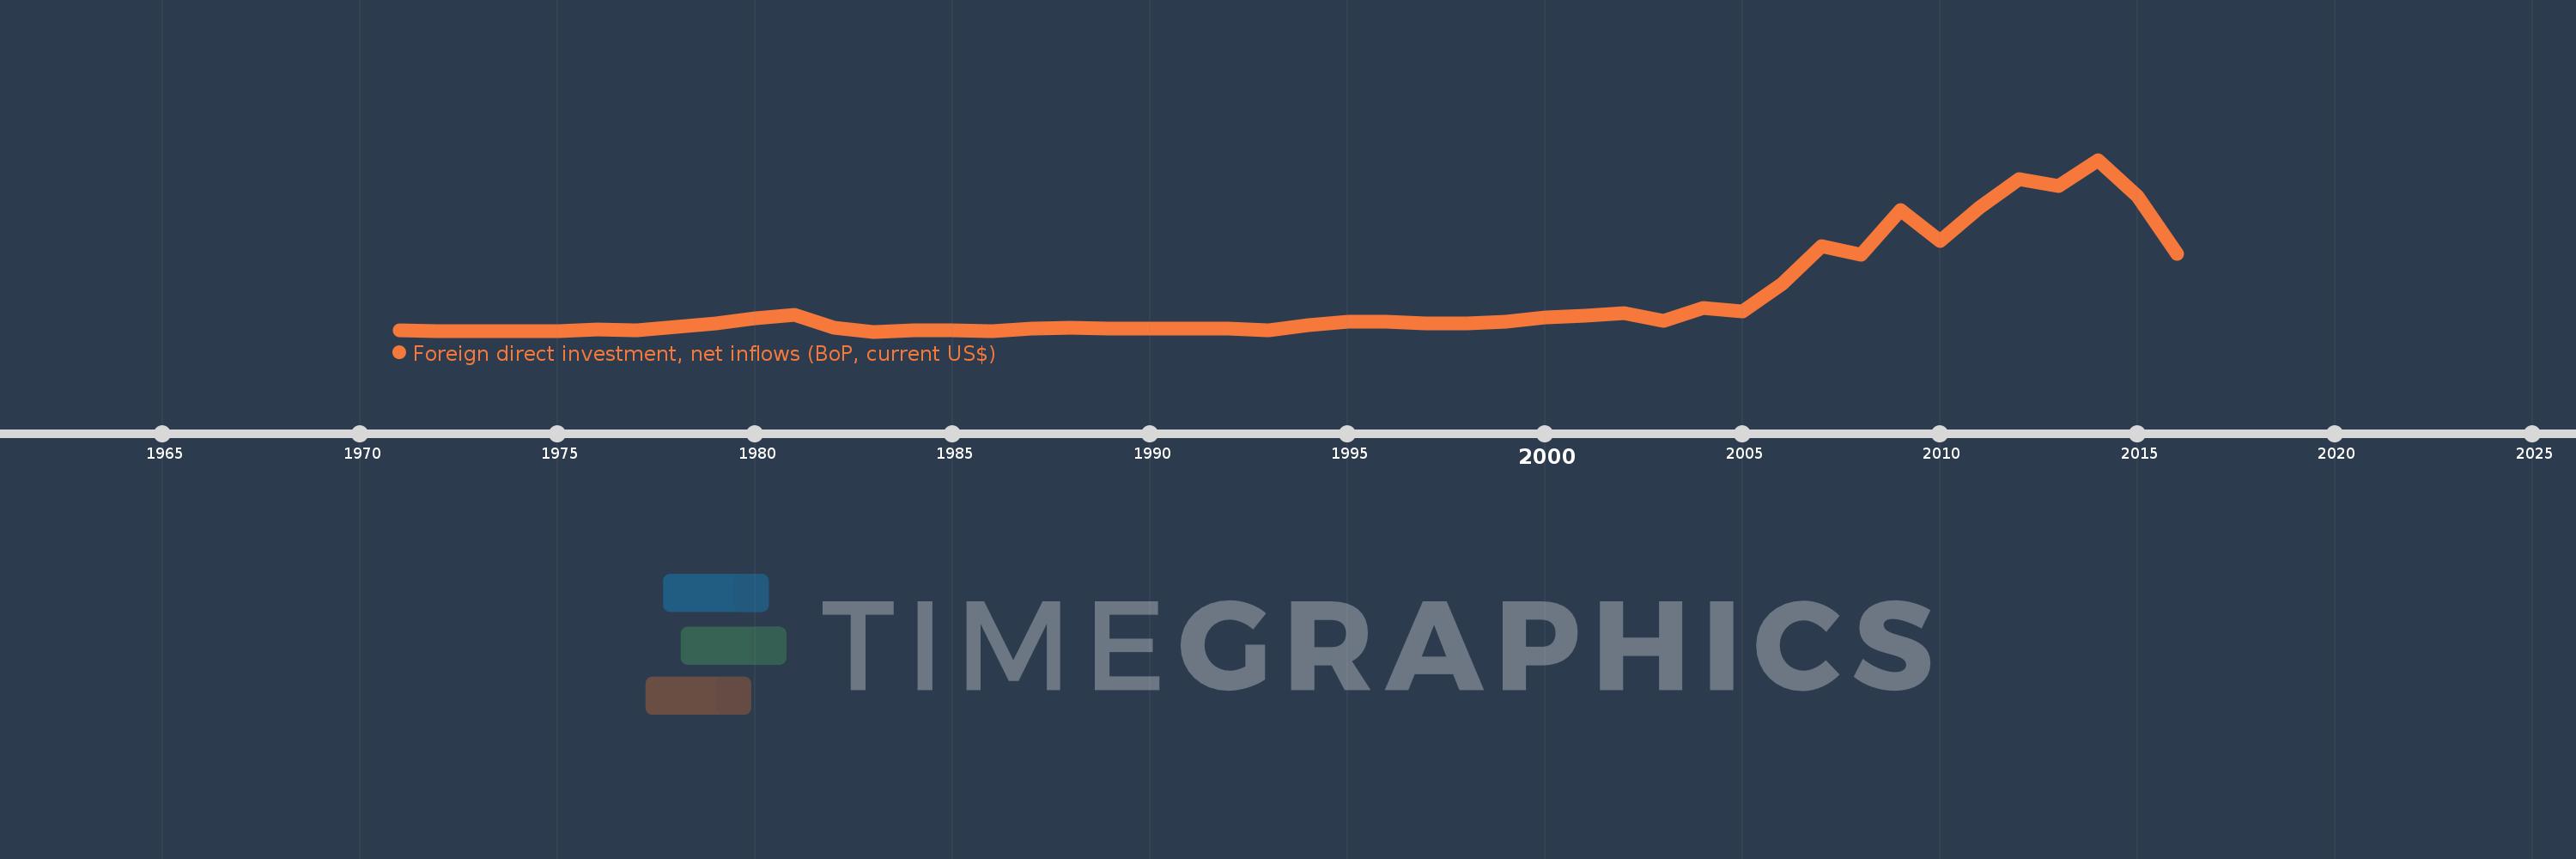
Foreign direct investment, net inflows (BoP, current US$)
2016,2015,2014,2013,2012,2011,2010,2009,2008,2007,2006,2005,2004,2003,2002,2001,2000,1999,1998,1997,1996,1995,1994,1993,1992,1991,1990,1989,1988,1987,1986,1985,1984,1983,1982,1981,1980,1979,1978,1977,1976,1975,1974,1973,1972,1971
This statistics in other country:
AfghanistanAlbaniaAlgeriaAngolaAntigua and BarbudaArab WorldArgentinaArmeniaArubaAustraliaAustriaAzerbaijanBahamas, TheBahrainBangladeshBarbadosBelarusBelgiumBelizeBeninBermudaBhutanBoliviaBosnia and HerzegovinaBotswanaBrazilBritish Virgin IslandsBrunei DarussalamBulgariaBurkina FasoBurundiCabo VerdeCambodiaCameroonCanadaCaribbean small statesCayman IslandsCentral African RepublicCentral Europe and the BalticsChadChileChinaColombiaComorosCongo, Dem. Rep.Congo, Rep.Costa RicaCote d'IvoireCroatiaCuracaoCyprusCzech RepublicDenmarkDjiboutiDominicaDominican RepublicEarly-demographic dividendEast Asia & PacificEast Asia & Pacific (excluding high income)East Asia & Pacific (IDA & IBRD countries)EcuadorEgypt, Arab Rep.El SalvadorEquatorial GuineaEritreaEstoniaEthiopiaEuro areaEurope & Central AsiaEurope & Central Asia (excluding high income)Europe & Central Asia (IDA & IBRD countries)European UnionFijiFinlandFragile and conflict affected situationsFranceFrench PolynesiaGabonGambia, TheGeorgiaGermanyGhanaGibraltarGreeceGrenadaGuatemalaGuineaGuinea-BissauGuyanaHaitiHeavily indebted poor countries (HIPC)High incomeHondurasHong Kong SAR, ChinaHungaryIBRD onlyIcelandIDA & IBRD totalIDA blendIDA onlyIDA totalIndiaIndonesiaIran, Islamic Rep.IraqIrelandIsraelItalyJamaicaJapanJordanKazakhstanKenyaKiribatiKorea, Dem. People’s Rep.Korea, Rep.KosovoKuwaitKyrgyz RepublicLao PDRLate-demographic dividendLatin America & Caribbean Latin America & Caribbean (excluding high income)Latin America & the Caribbean (IDA & IBRD countries)LatviaLeast developed countries: UN classificationLebanonLesothoLiberiaLibyaLithuaniaLow & middle incomeLow incomeLower middle incomeLuxembourgMacao SAR, ChinaMacedonia, FYRMadagascarMalawiMalaysiaMaldivesMaliMaltaMarshall IslandsMauritaniaMauritiusMexicoMicronesia, Fed. Sts.Middle East & North AfricaMiddle East & North Africa (excluding high income)Middle East & North Africa (IDA & IBRD countries)Middle incomeMoldovaMongoliaMontenegroMoroccoMozambiqueMyanmarNamibiaNauruNepalNetherlandsNew CaledoniaNew ZealandNicaraguaNigerNigeriaNorth AmericaNorthern Mariana IslandsNorwayOECD membersOmanOther small statesPacific island small statesPakistanPalauPanamaPapua New GuineaParaguayPeruPhilippinesPolandPortugalPost-demographic dividendPre-demographic dividendQatarRomaniaRussian FederationRwandaSamoaSao Tome and PrincipeSaudi ArabiaSenegalSerbiaSeychellesSierra LeoneSingaporeSint Maarten (Dutch part)Slovak RepublicSloveniaSmall statesSolomon IslandsSomaliaSouth AfricaSouth AsiaSouth Asia (IDA & IBRD)South SudanSpainSri LankaSt. Kitts and NevisSt. LuciaSt. Vincent and the GrenadinesSub-Saharan Africa Sub-Saharan Africa (excluding high income)Sub-Saharan Africa (IDA & IBRD countries)SudanSurinameSwazilandSwedenSwitzerlandSyrian Arab RepublicTajikistanTanzaniaThailandTimor-LesteTogoTongaTrinidad and TobagoTunisiaTurkeyTurkmenistanTuvaluUgandaUkraineUnited Arab EmiratesUnited KingdomUnited StatesUpper middle incomeUruguayUzbekistanVanuatuVenezuela, RBVietnamWest Bank and GazaWorldYemen, Rep.ZambiaZimbabwe Timeline:
This timeline shows a graph from 1971 to 2016 of Uruguay. No data until 1970. Number of actual observations by date: 46.
Source name:
World Development Indicators
Source organization:
International Monetary Fund, Balance of Payments database, supplemented by data from the United Nations Conference on Trade and Development and official national sources.
Categories, topics:
Economy & Growth, Financial Sector, External Debt
Last updated:
apr 23, 2017
Indicators value changes by year
Minimum:
-13.7 mln
jan 1, 1983
Maximum:
3.04 bln
jan 1, 2014
At the date of observation
Value
Absolute change
Change from previous value
jan 1, 1971
2.13 mln
+2.13 mln
0.0%
jan 1, 1972
-830.0K
-2.96 mln
-138.97%
jan 1, 1973
-1.14 mln
-310.0K
37.35%
jan 1, 1974
1.39 mln
+2.53 mln
-221.93%
jan 1, 1975
-80.0K
-1.47 mln
-105.76%
jan 1, 1976
22.64 mln
+22.72 mln
-28.4K%
jan 1, 1977
3.15 mln
-19.49 mln
-86.09%
jan 1, 1978
66.0 mln
+62.85 mln
2.0K%
jan 1, 1979
128.8 mln
+62.8 mln
95.15%
jan 1, 1980
215.5 mln
+86.7 mln
67.31%
jan 1, 1981
289.5 mln
+74.0 mln
34.34%
jan 1, 1982
48.6 mln
-240.9 mln
-83.21%
jan 1, 1983
-13.7 mln
-62.3 mln
-128.19%
jan 1, 1984
5.6 mln
+19.3 mln
-140.88%
jan 1, 1985
3.4 mln
-2.2 mln
-39.29%
jan 1, 1986
-7.9 mln
-11.3 mln
-332.35%
jan 1, 1987
37.0 mln
+44.9 mln
-568.35%
jan 1, 1988
50.1 mln
+13.1 mln
35.41%
jan 1, 1989
46.8 mln
-3.3 mln
-6.59%
jan 1, 1990
37.7 mln
-9.1 mln
-19.44%
jan 1, 1991
41.54 mln
+3.84 mln
10.19%
jan 1, 1992
32.34 mln
-9.2 mln
-22.15%
jan 1, 1993
11.3 mln
-21.04 mln
-65.06%
jan 1, 1994
101.5 mln
+90.2 mln
798.23%
jan 1, 1995
154.5 mln
+53.0 mln
52.22%
jan 1, 1996
156.6 mln
+2.1 mln
1.36%
jan 1, 1997
136.8 mln
-19.8 mln
-12.64%
jan 1, 1998
126.4 mln
-10.4 mln
-7.6%
jan 1, 1999
164.1 mln
+37.7 mln
29.83%
jan 1, 2000
235.3 mln
+71.2 mln
43.39%
jan 1, 2001
262.825 mln
+27.525 mln
11.7%
jan 1, 2002
310.403 mln
+47.578 mln
18.1%
jan 1, 2003
179.852 mln
-130.551 mln
-42.06%
jan 1, 2004
402.717 mln
+222.865 mln
123.92%
jan 1, 2005
352.713 mln
-50.005 mln
-12.42%
jan 1, 2006
826.627 mln
+473.914 mln
134.36%
jan 1, 2007
1.508 bln
+681.724 mln
82.47%
jan 1, 2008
1.359 bln
-149.614 mln
-9.92%
jan 1, 2009
2.142 bln
+783.233 mln
57.64%
jan 1, 2010
1.603 bln
-539.378 mln
-25.18%
jan 1, 2011
2.191 bln
+588.476 mln
36.72%
jan 1, 2012
2.69 bln
+499.026 mln
22.78%
jan 1, 2013
2.569 bln
-120.879 mln
-4.49%
jan 1, 2014
3.04 bln
+470.937 mln
18.33%
jan 1, 2015
2.385 bln
-655.061 mln
-21.55%
jan 1, 2016
1.369 bln
-1.016 bln
-42.59%
Ranking of countries by current statistics by years


Comments: