29
/
en
AIzaSyAYiBZKx7MnpbEhh9jyipgxe19OcubqV5w
April 1, 2024
37345
IDA & IBRD total
IBT
false
2
1
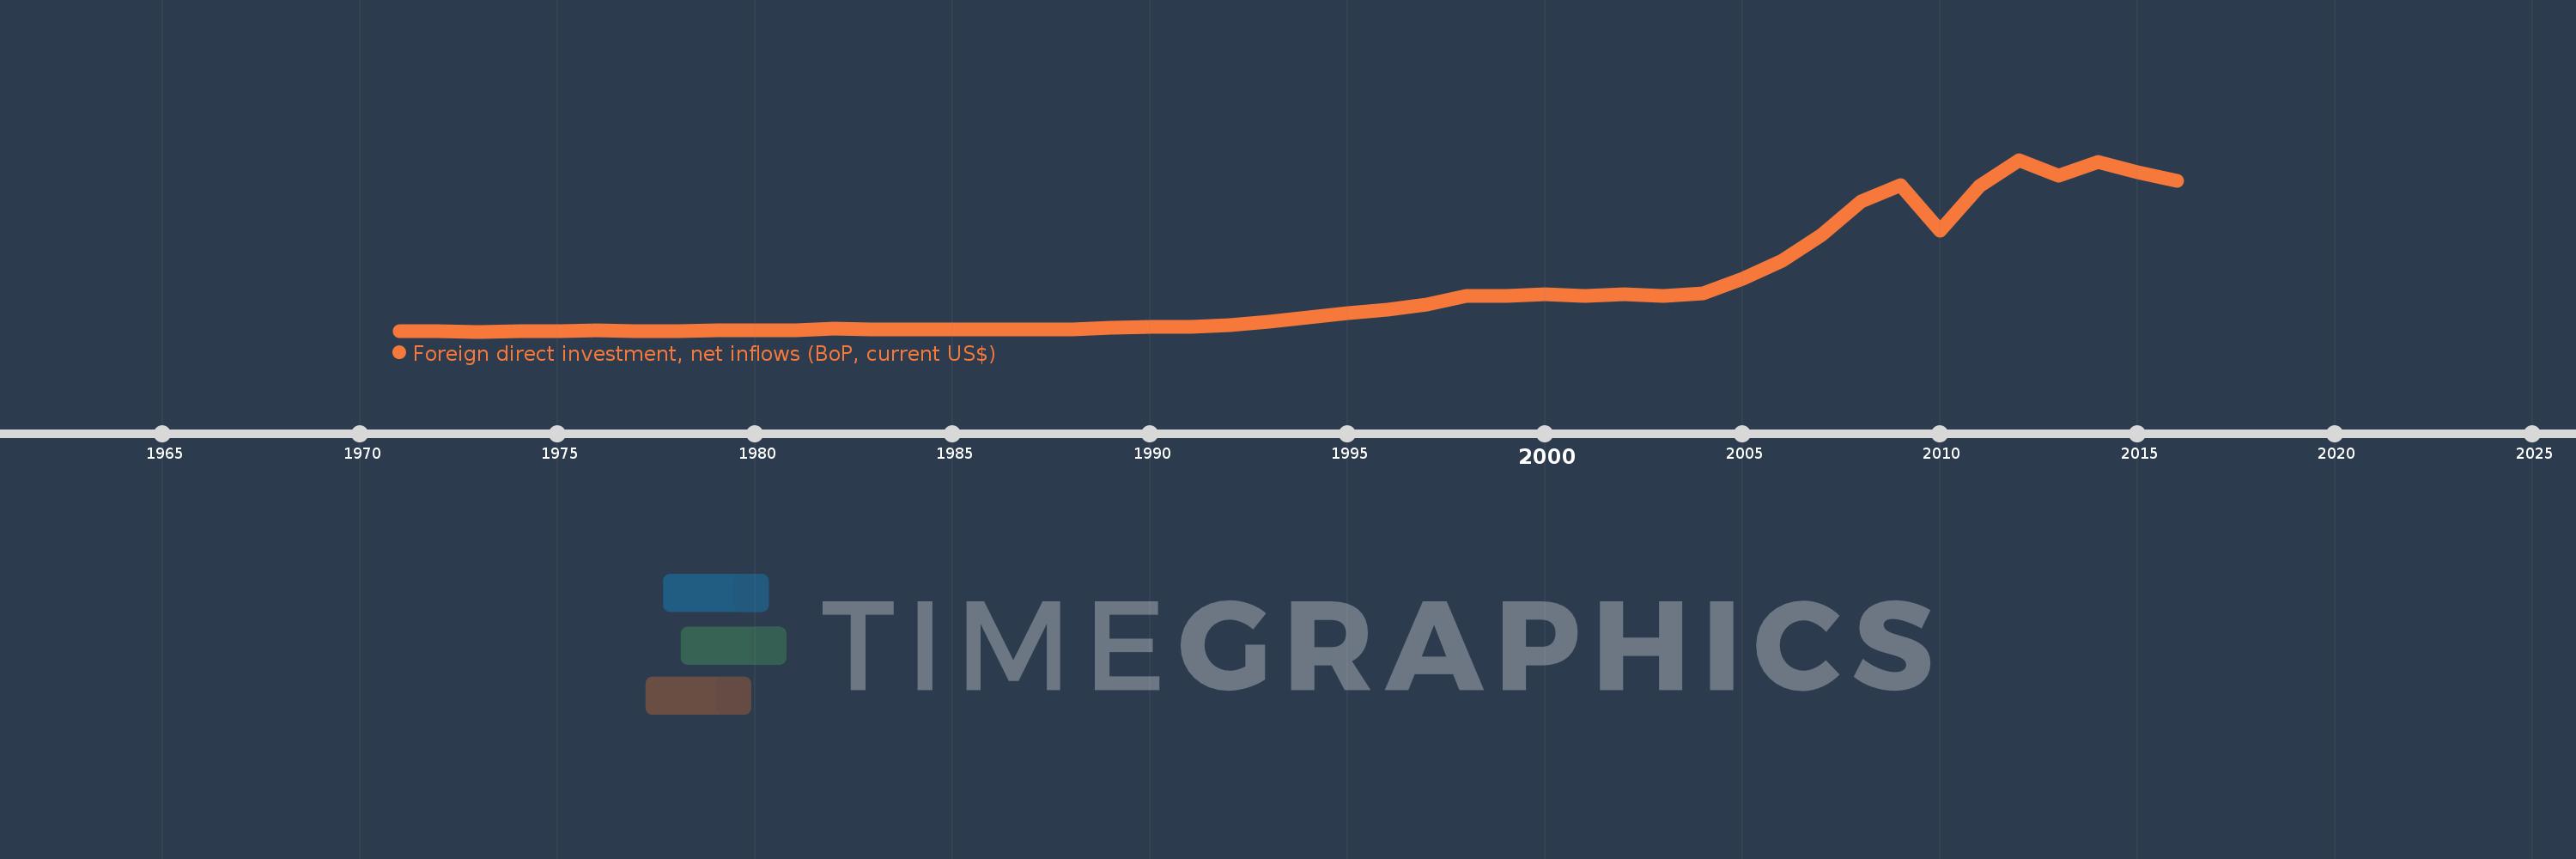
Foreign direct investment, net inflows (BoP, current US$)
2016,2015,2014,2013,2012,2011,2010,2009,2008,2007,2006,2005,2004,2003,2002,2001,2000,1999,1998,1997,1996,1995,1994,1993,1992,1991,1990,1989,1988,1987,1986,1985,1984,1983,1982,1981,1980,1979,1978,1977,1976,1975,1974,1973,1972,1971
This statistics in other country:
AfghanistanAlbaniaAlgeriaAngolaAntigua and BarbudaArab WorldArgentinaArmeniaArubaAustraliaAustriaAzerbaijanBahamas, TheBahrainBangladeshBarbadosBelarusBelgiumBelizeBeninBermudaBhutanBoliviaBosnia and HerzegovinaBotswanaBrazilBritish Virgin IslandsBrunei DarussalamBulgariaBurkina FasoBurundiCabo VerdeCambodiaCameroonCanadaCaribbean small statesCayman IslandsCentral African RepublicCentral Europe and the BalticsChadChileChinaColombiaComorosCongo, Dem. Rep.Congo, Rep.Costa RicaCote d'IvoireCroatiaCuracaoCyprusCzech RepublicDenmarkDjiboutiDominicaDominican RepublicEarly-demographic dividendEast Asia & PacificEast Asia & Pacific (excluding high income)East Asia & Pacific (IDA & IBRD countries)EcuadorEgypt, Arab Rep.El SalvadorEquatorial GuineaEritreaEstoniaEthiopiaEuro areaEurope & Central AsiaEurope & Central Asia (excluding high income)Europe & Central Asia (IDA & IBRD countries)European UnionFijiFinlandFragile and conflict affected situationsFranceFrench PolynesiaGabonGambia, TheGeorgiaGermanyGhanaGibraltarGreeceGrenadaGuatemalaGuineaGuinea-BissauGuyanaHaitiHeavily indebted poor countries (HIPC)High incomeHondurasHong Kong SAR, ChinaHungaryIBRD onlyIcelandIDA & IBRD totalIDA blendIDA onlyIDA totalIndiaIndonesiaIran, Islamic Rep.IraqIrelandIsraelItalyJamaicaJapanJordanKazakhstanKenyaKiribatiKorea, Dem. People’s Rep.Korea, Rep.KosovoKuwaitKyrgyz RepublicLao PDRLate-demographic dividendLatin America & Caribbean Latin America & Caribbean (excluding high income)Latin America & the Caribbean (IDA & IBRD countries)LatviaLeast developed countries: UN classificationLebanonLesothoLiberiaLibyaLithuaniaLow & middle incomeLow incomeLower middle incomeLuxembourgMacao SAR, ChinaMacedonia, FYRMadagascarMalawiMalaysiaMaldivesMaliMaltaMarshall IslandsMauritaniaMauritiusMexicoMicronesia, Fed. Sts.Middle East & North AfricaMiddle East & North Africa (excluding high income)Middle East & North Africa (IDA & IBRD countries)Middle incomeMoldovaMongoliaMontenegroMoroccoMozambiqueMyanmarNamibiaNauruNepalNetherlandsNew CaledoniaNew ZealandNicaraguaNigerNigeriaNorth AmericaNorthern Mariana IslandsNorwayOECD membersOmanOther small statesPacific island small statesPakistanPalauPanamaPapua New GuineaParaguayPeruPhilippinesPolandPortugalPost-demographic dividendPre-demographic dividendQatarRomaniaRussian FederationRwandaSamoaSao Tome and PrincipeSaudi ArabiaSenegalSerbiaSeychellesSierra LeoneSingaporeSint Maarten (Dutch part)Slovak RepublicSloveniaSmall statesSolomon IslandsSomaliaSouth AfricaSouth AsiaSouth Asia (IDA & IBRD)South SudanSpainSri LankaSt. Kitts and NevisSt. LuciaSt. Vincent and the GrenadinesSub-Saharan Africa Sub-Saharan Africa (excluding high income)Sub-Saharan Africa (IDA & IBRD countries)SudanSurinameSwazilandSwedenSwitzerlandSyrian Arab RepublicTajikistanTanzaniaThailandTimor-LesteTogoTongaTrinidad and TobagoTunisiaTurkeyTurkmenistanTuvaluUgandaUkraineUnited Arab EmiratesUnited KingdomUnited StatesUpper middle incomeUruguayUzbekistanVanuatuVenezuela, RBVietnamWest Bank and GazaWorldYemen, Rep.ZambiaZimbabwe Timeline:
This timeline shows a graph from 1971 to 2016 of IDA & IBRD total. No data until 1970. Number of actual observations by date: 46.
Source name:
World Development Indicators
Source organization:
International Monetary Fund, Balance of Payments database, supplemented by data from the United Nations Conference on Trade and Development and official national sources.
Categories, topics:
Economy & Growth, Financial Sector, External Debt
Last updated:
apr 23, 2017
Indicators value changes by year
Minimum:
1.059 bln
jan 1, 1973
Maximum:
782.338 bln
jan 1, 2012
At the date of observation
Value
Absolute change
Change from previous value
jan 1, 1971
1.686 bln
+1.686 bln
0.0%
jan 1, 1972
1.73 bln
+44.261 mln
2.63%
jan 1, 1973
1.059 bln
-671.208 mln
-38.8%
jan 1, 1974
2.357 bln
+1.298 bln
122.61%
jan 1, 1975
3.179 bln
+822.025 mln
34.88%
jan 1, 1976
5.037 bln
+1.858 bln
58.43%
jan 1, 1977
3.796 bln
-1.24 bln
-24.63%
jan 1, 1978
4.788 bln
+991.432 mln
26.12%
jan 1, 1979
6.469 bln
+1.682 bln
35.12%
jan 1, 1980
7.848 bln
+1.379 bln
21.32%
jan 1, 1981
8.278 bln
+430.048 mln
5.48%
jan 1, 1982
13.093 bln
+4.814 bln
58.16%
jan 1, 1983
11.334 bln
-1.758 bln
-13.43%
jan 1, 1984
9.65 bln
-1.684 bln
-14.86%
jan 1, 1985
9.269 bln
-381.8 mln
-3.96%
jan 1, 1986
11.713 bln
+2.444 bln
26.37%
jan 1, 1987
9.551 bln
-2.162 bln
-18.46%
jan 1, 1988
10.338 bln
+787.728 mln
8.25%
jan 1, 1989
18.01 bln
+7.671 bln
74.2%
jan 1, 1990
21.923 bln
+3.914 bln
21.73%
jan 1, 1991
21.994 bln
+71.22 mln
0.32%
jan 1, 1992
31.103 bln
+9.109 bln
41.41%
jan 1, 1993
44.238 bln
+13.135 bln
42.23%
jan 1, 1994
64.809 bln
+20.571 bln
46.5%
jan 1, 1995
86.817 bln
+22.009 bln
33.96%
jan 1, 1996
98.856 bln
+12.039 bln
13.87%
jan 1, 1997
123.392 bln
+24.536 bln
24.82%
jan 1, 1998
162.067 bln
+38.675 bln
31.34%
jan 1, 1999
163.363 bln
+1.297 bln
0.8%
jan 1, 2000
171.725 bln
+8.361 bln
5.12%
jan 1, 2001
163.098 bln
-8.627 bln
-5.02%
jan 1, 2002
171.577 bln
+8.479 bln
5.2%
jan 1, 2003
163.204 bln
-8.373 bln
-4.88%
jan 1, 2004
175.657 bln
+12.454 bln
7.63%
jan 1, 2005
241.51 bln
+65.853 bln
37.49%
jan 1, 2006
324.201 bln
+82.69 bln
34.24%
jan 1, 2007
440.401 bln
+116.201 bln
35.84%
jan 1, 2008
593.687 bln
+153.285 bln
34.81%
jan 1, 2009
667.622 bln
+73.936 bln
12.45%
jan 1, 2010
459.061 bln
-208.562 bln
-31.24%
jan 1, 2011
662.035 bln
+202.974 bln
44.22%
jan 1, 2012
782.338 bln
+120.304 bln
18.17%
jan 1, 2013
711.8 bln
-70.538 bln
-9.02%
jan 1, 2014
771.462 bln
+59.662 bln
8.38%
jan 1, 2015
725.177 bln
-46.285 bln
-6.0%
jan 1, 2016
685.586 bln
-39.591 bln
-5.46%
Ranking of countries by current statistics by years


Comments: