29
/
en
AIzaSyAYiBZKx7MnpbEhh9jyipgxe19OcubqV5w
April 1, 2024
34951
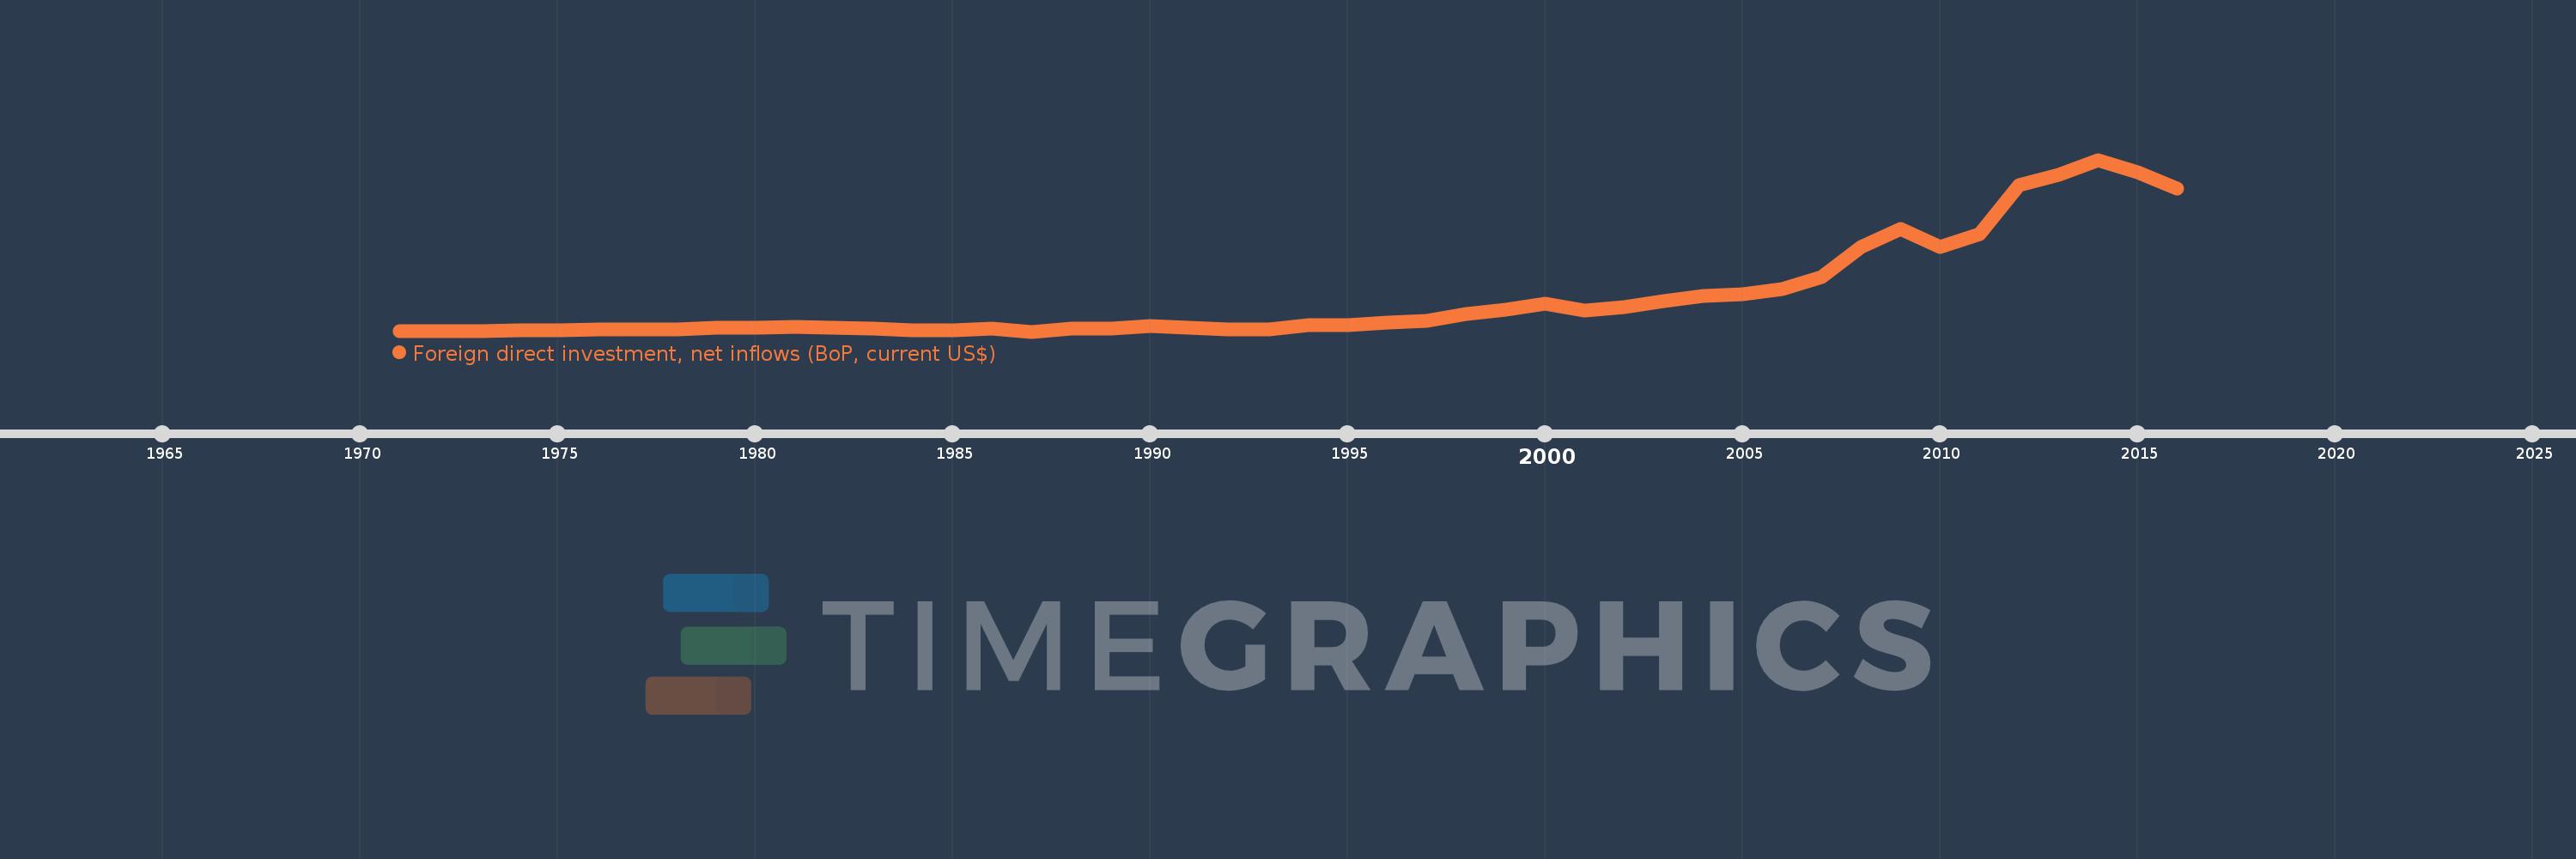
Heavily indebted poor countries (HIPC)
HPC
false
2
1
Foreign direct investment, net inflows (BoP, current US$)
2016,2015,2014,2013,2012,2011,2010,2009,2008,2007,2006,2005,2004,2003,2002,2001,2000,1999,1998,1997,1996,1995,1994,1993,1992,1991,1990,1989,1988,1987,1986,1985,1984,1983,1982,1981,1980,1979,1978,1977,1976,1975,1974,1973,1972,1971
This statistics in other country:
AfghanistanAlbaniaAlgeriaAngolaAntigua and BarbudaArab WorldArgentinaArmeniaArubaAustraliaAustriaAzerbaijanBahamas, TheBahrainBangladeshBarbadosBelarusBelgiumBelizeBeninBermudaBhutanBoliviaBosnia and HerzegovinaBotswanaBrazilBritish Virgin IslandsBrunei DarussalamBulgariaBurkina FasoBurundiCabo VerdeCambodiaCameroonCanadaCaribbean small statesCayman IslandsCentral African RepublicCentral Europe and the BalticsChadChileChinaColombiaComorosCongo, Dem. Rep.Congo, Rep.Costa RicaCote d'IvoireCroatiaCuracaoCyprusCzech RepublicDenmarkDjiboutiDominicaDominican RepublicEarly-demographic dividendEast Asia & PacificEast Asia & Pacific (excluding high income)East Asia & Pacific (IDA & IBRD countries)EcuadorEgypt, Arab Rep.El SalvadorEquatorial GuineaEritreaEstoniaEthiopiaEuro areaEurope & Central AsiaEurope & Central Asia (excluding high income)Europe & Central Asia (IDA & IBRD countries)European UnionFijiFinlandFragile and conflict affected situationsFranceFrench PolynesiaGabonGambia, TheGeorgiaGermanyGhanaGibraltarGreeceGrenadaGuatemalaGuineaGuinea-BissauGuyanaHaitiHeavily indebted poor countries (HIPC)High incomeHondurasHong Kong SAR, ChinaHungaryIBRD onlyIcelandIDA & IBRD totalIDA blendIDA onlyIDA totalIndiaIndonesiaIran, Islamic Rep.IraqIrelandIsraelItalyJamaicaJapanJordanKazakhstanKenyaKiribatiKorea, Dem. People’s Rep.Korea, Rep.KosovoKuwaitKyrgyz RepublicLao PDRLate-demographic dividendLatin America & Caribbean Latin America & Caribbean (excluding high income)Latin America & the Caribbean (IDA & IBRD countries)LatviaLeast developed countries: UN classificationLebanonLesothoLiberiaLibyaLithuaniaLow & middle incomeLow incomeLower middle incomeLuxembourgMacao SAR, ChinaMacedonia, FYRMadagascarMalawiMalaysiaMaldivesMaliMaltaMarshall IslandsMauritaniaMauritiusMexicoMicronesia, Fed. Sts.Middle East & North AfricaMiddle East & North Africa (excluding high income)Middle East & North Africa (IDA & IBRD countries)Middle incomeMoldovaMongoliaMontenegroMoroccoMozambiqueMyanmarNamibiaNauruNepalNetherlandsNew CaledoniaNew ZealandNicaraguaNigerNigeriaNorth AmericaNorthern Mariana IslandsNorwayOECD membersOmanOther small statesPacific island small statesPakistanPalauPanamaPapua New GuineaParaguayPeruPhilippinesPolandPortugalPost-demographic dividendPre-demographic dividendQatarRomaniaRussian FederationRwandaSamoaSao Tome and PrincipeSaudi ArabiaSenegalSerbiaSeychellesSierra LeoneSingaporeSint Maarten (Dutch part)Slovak RepublicSloveniaSmall statesSolomon IslandsSomaliaSouth AfricaSouth AsiaSouth Asia (IDA & IBRD)South SudanSpainSri LankaSt. Kitts and NevisSt. LuciaSt. Vincent and the GrenadinesSub-Saharan Africa Sub-Saharan Africa (excluding high income)Sub-Saharan Africa (IDA & IBRD countries)SudanSurinameSwazilandSwedenSwitzerlandSyrian Arab RepublicTajikistanTanzaniaThailandTimor-LesteTogoTongaTrinidad and TobagoTunisiaTurkeyTurkmenistanTuvaluUgandaUkraineUnited Arab EmiratesUnited KingdomUnited StatesUpper middle incomeUruguayUzbekistanVanuatuVenezuela, RBVietnamWest Bank and GazaWorldYemen, Rep.ZambiaZimbabwe Timeline:
This timeline shows a graph from 1971 to 2016 of Heavily indebted poor countries (HIPC). No data until 1970. Number of actual observations by date: 46.
Source name:
World Development Indicators
Source organization:
International Monetary Fund, Balance of Payments database, supplemented by data from the United Nations Conference on Trade and Development and official national sources.
Categories, topics:
Economy & Growth, Financial Sector, External Debt
Last updated:
apr 23, 2017
Indicators value changes by year
Minimum:
8.057 mln
jan 1, 1987
Maximum:
32.605 bln
jan 1, 2014
At the date of observation
Value
Absolute change
Change from previous value
jan 1, 1971
164.294 mln
+164.294 mln
0.0%
jan 1, 1972
34.25 mln
-130.044 mln
-79.15%
jan 1, 1973
149.045 mln
+114.795 mln
335.17%
jan 1, 1974
216.91 mln
+67.865 mln
45.53%
jan 1, 1975
239.439 mln
+22.529 mln
10.39%
jan 1, 1976
442.641 mln
+203.202 mln
84.87%
jan 1, 1977
486.197 mln
+43.556 mln
9.84%
jan 1, 1978
421.832 mln
-64.365 mln
-13.24%
jan 1, 1979
691.848 mln
+270.016 mln
64.01%
jan 1, 1980
727.159 mln
+35.311 mln
5.1%
jan 1, 1981
830.105 mln
+102.946 mln
14.16%
jan 1, 1982
819.254 mln
-10.85 mln
-1.31%
jan 1, 1983
547.393 mln
-271.861 mln
-33.18%
jan 1, 1984
238.498 mln
-308.895 mln
-56.43%
jan 1, 1985
242.531 mln
+4.033 mln
1.69%
jan 1, 1986
570.05 mln
+327.519 mln
135.04%
jan 1, 1987
8.057 mln
-561.993 mln
-98.59%
jan 1, 1988
628.869 mln
+620.811 mln
7.7K%
jan 1, 1989
645.537 mln
+16.668 mln
2.65%
jan 1, 1990
986.473 mln
+340.936 mln
52.81%
jan 1, 1991
773.825 mln
-212.649 mln
-21.56%
jan 1, 1992
477.559 mln
-296.265 mln
-38.29%
jan 1, 1993
362.099 mln
-115.46 mln
-24.18%
jan 1, 1994
1.162 bln
+799.939 mln
220.92%
jan 1, 1995
1.159 bln
-3.36 mln
-0.29%
jan 1, 1996
1.738 bln
+579.168 mln
49.99%
jan 1, 1997
1.973 bln
+235.214 mln
13.53%
jan 1, 1998
3.399 bln
+1.426 bln
72.27%
jan 1, 1999
4.186 bln
+787.021 mln
23.15%
jan 1, 2000
5.226 bln
+1.04 bln
24.85%
jan 1, 2001
4.053 bln
-1.173 bln
-22.45%
jan 1, 2002
4.674 bln
+621.257 mln
15.33%
jan 1, 2003
5.862 bln
+1.187 bln
25.4%
jan 1, 2004
6.836 bln
+974.64 mln
16.63%
jan 1, 2005
7.082 bln
+246.205 mln
3.6%
jan 1, 2006
8.142 bln
+1.06 bln
14.97%
jan 1, 2007
10.313 bln
+2.171 bln
26.66%
jan 1, 2008
16.071 bln
+5.758 bln
55.83%
jan 1, 2009
19.466 bln
+3.395 bln
21.12%
jan 1, 2010
16.119 bln
-3.346 bln
-17.19%
jan 1, 2011
18.427 bln
+2.307 bln
14.31%
jan 1, 2012
27.846 bln
+9.42 bln
51.12%
jan 1, 2013
29.687 bln
+1.841 bln
6.61%
jan 1, 2014
32.605 bln
+2.917 bln
9.83%
jan 1, 2015
30.252 bln
-2.353 bln
-7.22%
jan 1, 2016
27.09 bln
-3.162 bln
-10.45%
Ranking of countries by current statistics by years


Comments: