29
/
en
AIzaSyAYiBZKx7MnpbEhh9jyipgxe19OcubqV5w
April 1, 2024
62584
World
WLD
false
2
1
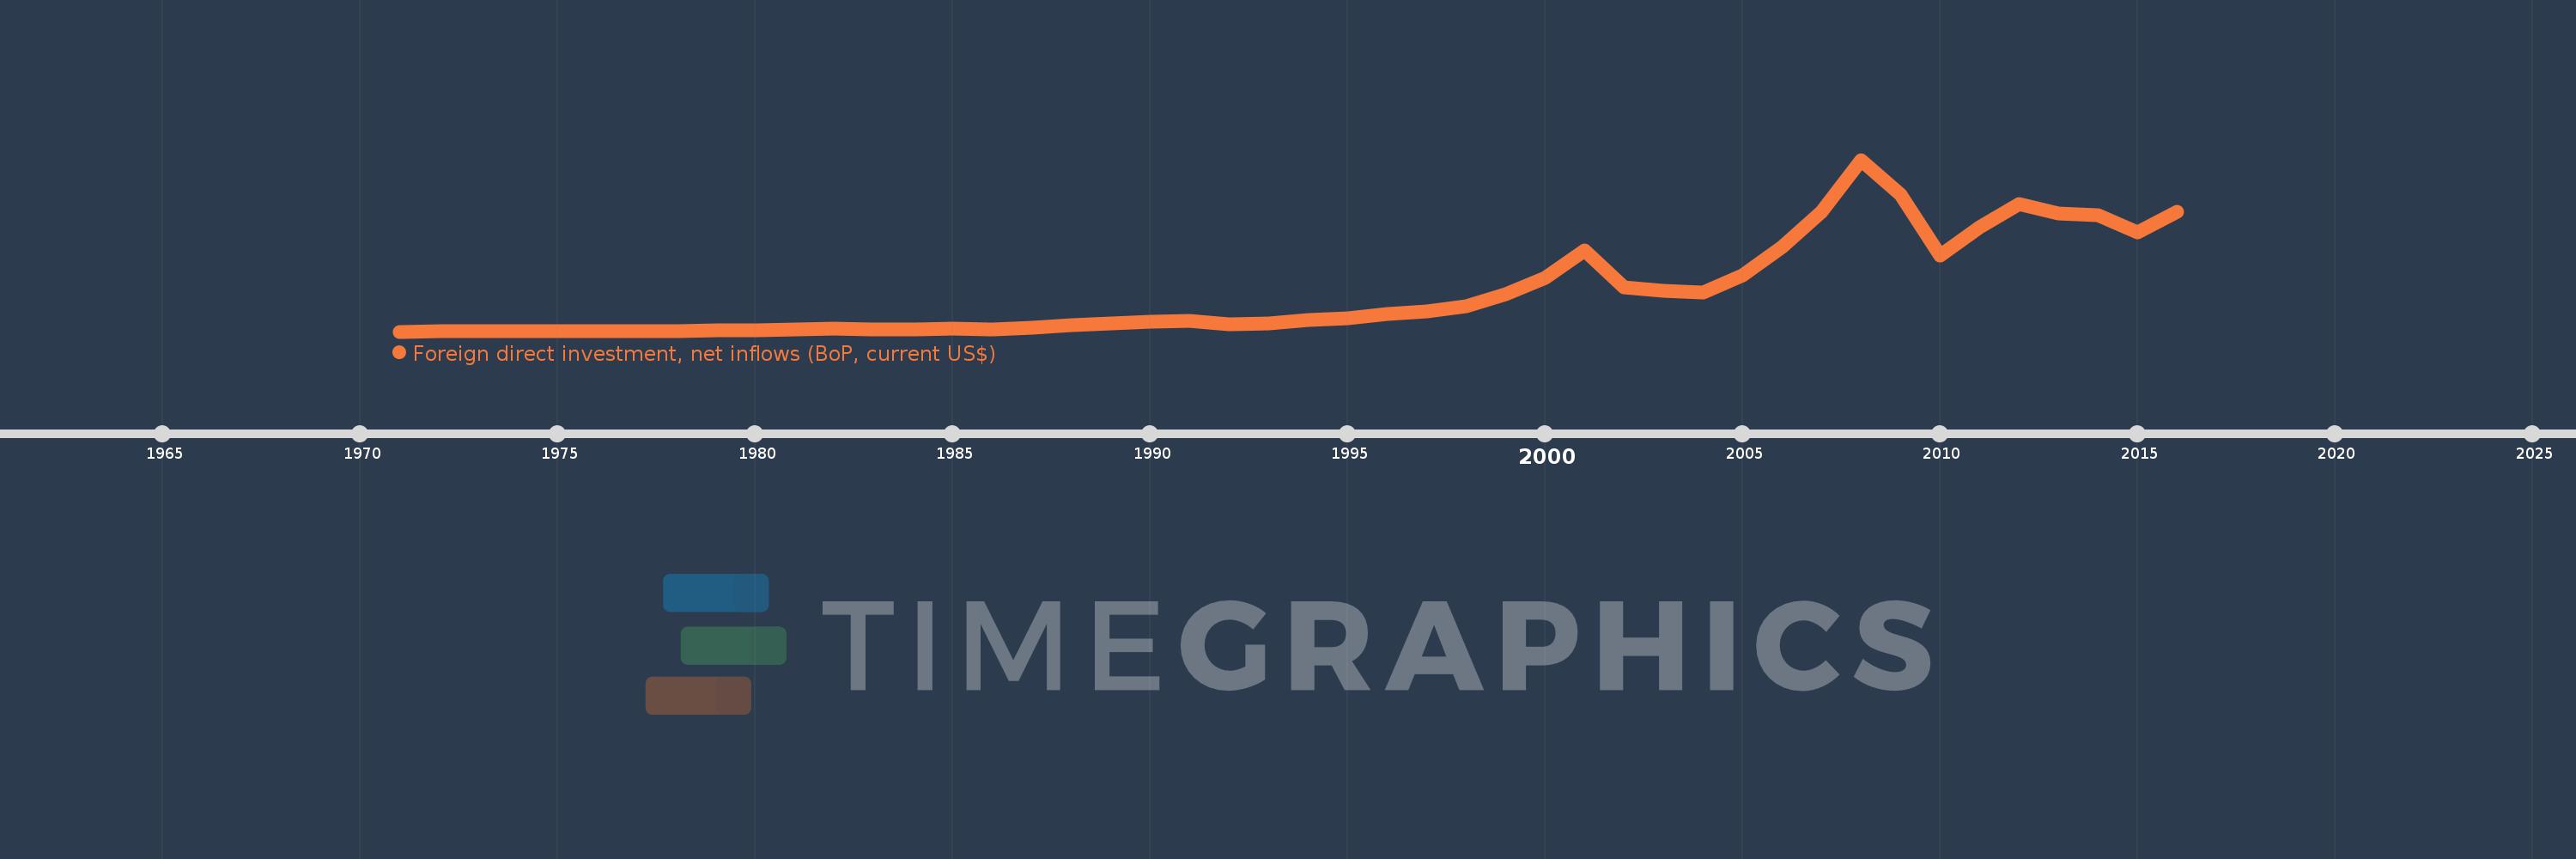
Foreign direct investment, net inflows (BoP, current US$)
2016,2015,2014,2013,2012,2011,2010,2009,2008,2007,2006,2005,2004,2003,2002,2001,2000,1999,1998,1997,1996,1995,1994,1993,1992,1991,1990,1989,1988,1987,1986,1985,1984,1983,1982,1981,1980,1979,1978,1977,1976,1975,1974,1973,1972,1971
This statistics in other country:
AfghanistanAlbaniaAlgeriaAngolaAntigua and BarbudaArab WorldArgentinaArmeniaArubaAustraliaAustriaAzerbaijanBahamas, TheBahrainBangladeshBarbadosBelarusBelgiumBelizeBeninBermudaBhutanBoliviaBosnia and HerzegovinaBotswanaBrazilBritish Virgin IslandsBrunei DarussalamBulgariaBurkina FasoBurundiCabo VerdeCambodiaCameroonCanadaCaribbean small statesCayman IslandsCentral African RepublicCentral Europe and the BalticsChadChileChinaColombiaComorosCongo, Dem. Rep.Congo, Rep.Costa RicaCote d'IvoireCroatiaCuracaoCyprusCzech RepublicDenmarkDjiboutiDominicaDominican RepublicEarly-demographic dividendEast Asia & PacificEast Asia & Pacific (excluding high income)East Asia & Pacific (IDA & IBRD countries)EcuadorEgypt, Arab Rep.El SalvadorEquatorial GuineaEritreaEstoniaEthiopiaEuro areaEurope & Central AsiaEurope & Central Asia (excluding high income)Europe & Central Asia (IDA & IBRD countries)European UnionFijiFinlandFragile and conflict affected situationsFranceFrench PolynesiaGabonGambia, TheGeorgiaGermanyGhanaGibraltarGreeceGrenadaGuatemalaGuineaGuinea-BissauGuyanaHaitiHeavily indebted poor countries (HIPC)High incomeHondurasHong Kong SAR, ChinaHungaryIBRD onlyIcelandIDA & IBRD totalIDA blendIDA onlyIDA totalIndiaIndonesiaIran, Islamic Rep.IraqIrelandIsraelItalyJamaicaJapanJordanKazakhstanKenyaKiribatiKorea, Dem. People’s Rep.Korea, Rep.KosovoKuwaitKyrgyz RepublicLao PDRLate-demographic dividendLatin America & Caribbean Latin America & Caribbean (excluding high income)Latin America & the Caribbean (IDA & IBRD countries)LatviaLeast developed countries: UN classificationLebanonLesothoLiberiaLibyaLithuaniaLow & middle incomeLow incomeLower middle incomeLuxembourgMacao SAR, ChinaMacedonia, FYRMadagascarMalawiMalaysiaMaldivesMaliMaltaMarshall IslandsMauritaniaMauritiusMexicoMicronesia, Fed. Sts.Middle East & North AfricaMiddle East & North Africa (excluding high income)Middle East & North Africa (IDA & IBRD countries)Middle incomeMoldovaMongoliaMontenegroMoroccoMozambiqueMyanmarNamibiaNauruNepalNetherlandsNew CaledoniaNew ZealandNicaraguaNigerNigeriaNorth AmericaNorthern Mariana IslandsNorwayOECD membersOmanOther small statesPacific island small statesPakistanPalauPanamaPapua New GuineaParaguayPeruPhilippinesPolandPortugalPost-demographic dividendPre-demographic dividendQatarRomaniaRussian FederationRwandaSamoaSao Tome and PrincipeSaudi ArabiaSenegalSerbiaSeychellesSierra LeoneSingaporeSint Maarten (Dutch part)Slovak RepublicSloveniaSmall statesSolomon IslandsSomaliaSouth AfricaSouth AsiaSouth Asia (IDA & IBRD)South SudanSpainSri LankaSt. Kitts and NevisSt. LuciaSt. Vincent and the GrenadinesSub-Saharan Africa Sub-Saharan Africa (excluding high income)Sub-Saharan Africa (IDA & IBRD countries)SudanSurinameSwazilandSwedenSwitzerlandSyrian Arab RepublicTajikistanTanzaniaThailandTimor-LesteTogoTongaTrinidad and TobagoTunisiaTurkeyTurkmenistanTuvaluUgandaUkraineUnited Arab EmiratesUnited KingdomUnited StatesUpper middle incomeUruguayUzbekistanVanuatuVenezuela, RBVietnamWest Bank and GazaWorldYemen, Rep.ZambiaZimbabwe Timeline:
This timeline shows a graph from 1971 to 2016 of World. No data until 1970. Number of actual observations by date: 46.
Source name:
World Development Indicators
Source organization:
International Monetary Fund, Balance of Payments database, supplemented by data from the United Nations Conference on Trade and Development and official national sources.
Categories, topics:
Economy & Growth, Financial Sector, External Debt
Last updated:
apr 23, 2017
Indicators value changes by year
Minimum:
10.172 bln
jan 1, 1971
Maximum:
3.065 trl
jan 1, 2008
At the date of observation
Value
Absolute change
Change from previous value
jan 1, 1971
10.172 bln
+10.172 bln
0.0%
jan 1, 1972
11.812 bln
+1.64 bln
16.12%
jan 1, 1973
12.204 bln
+391.613 mln
3.32%
jan 1, 1974
16.984 bln
+4.78 bln
39.17%
jan 1, 1975
20.149 bln
+3.166 bln
18.64%
jan 1, 1976
23.153 bln
+3.004 bln
14.91%
jan 1, 1977
18.451 bln
-4.702 bln
-20.31%
jan 1, 1978
25.242 bln
+6.791 bln
36.81%
jan 1, 1979
31.743 bln
+6.5 bln
25.75%
jan 1, 1980
40.477 bln
+8.734 bln
27.52%
jan 1, 1981
51.464 bln
+10.987 bln
27.14%
jan 1, 1982
66.261 bln
+14.798 bln
28.75%
jan 1, 1983
53.791 bln
-12.47 bln
-18.82%
jan 1, 1984
47.541 bln
-6.25 bln
-11.62%
jan 1, 1985
57.513 bln
+9.972 bln
20.98%
jan 1, 1986
55.831 bln
-1.682 bln
-2.92%
jan 1, 1987
84.563 bln
+28.731 bln
51.46%
jan 1, 1988
128.227 bln
+43.665 bln
51.64%
jan 1, 1989
153.27 bln
+25.043 bln
19.53%
jan 1, 1990
189.101 bln
+35.832 bln
23.38%
jan 1, 1991
196.315 bln
+7.213 bln
3.81%
jan 1, 1992
147.009 bln
-49.306 bln
-25.12%
jan 1, 1993
153.248 bln
+6.24 bln
4.24%
jan 1, 1994
211.748 bln
+58.499 bln
38.17%
jan 1, 1995
241.856 bln
+30.109 bln
14.22%
jan 1, 1996
319.9 bln
+78.044 bln
32.27%
jan 1, 1997
363.576 bln
+43.675 bln
13.65%
jan 1, 1998
461.268 bln
+97.693 bln
26.87%
jan 1, 1999
679.308 bln
+218.039 bln
47.27%
jan 1, 2000
961.898 bln
+282.591 bln
41.6%
jan 1, 2001
1.461 trl
+498.732 bln
51.85%
jan 1, 2002
796.076 bln
-664.554 bln
-45.5%
jan 1, 2003
741.532 bln
-54.544 bln
-6.85%
jan 1, 2004
709.827 bln
-31.706 bln
-4.28%
jan 1, 2005
1.004 trl
+294.41 bln
41.48%
jan 1, 2006
1.522 trl
+517.977 bln
51.58%
jan 1, 2007
2.136 trl
+613.911 bln
40.33%
jan 1, 2008
3.065 trl
+929.229 bln
43.5%
jan 1, 2009
2.444 trl
-621.668 bln
-20.28%
jan 1, 2010
1.361 trl
-1.083 trl
-44.32%
jan 1, 2011
1.859 trl
+498.207 bln
36.61%
jan 1, 2012
2.286 trl
+426.812 bln
22.96%
jan 1, 2013
2.111 trl
-174.874 bln
-7.65%
jan 1, 2014
2.086 trl
-24.546 bln
-1.16%
jan 1, 2015
1.78 trl
-306.241 bln
-14.68%
jan 1, 2016
2.136 trl
+355.61 bln
19.98%
Ranking of countries by current statistics by years


Comments: