29
/
en
AIzaSyAYiBZKx7MnpbEhh9jyipgxe19OcubqV5w
April 1, 2024
34215
Fragile and conflict affected situations
FCS
false
2
1
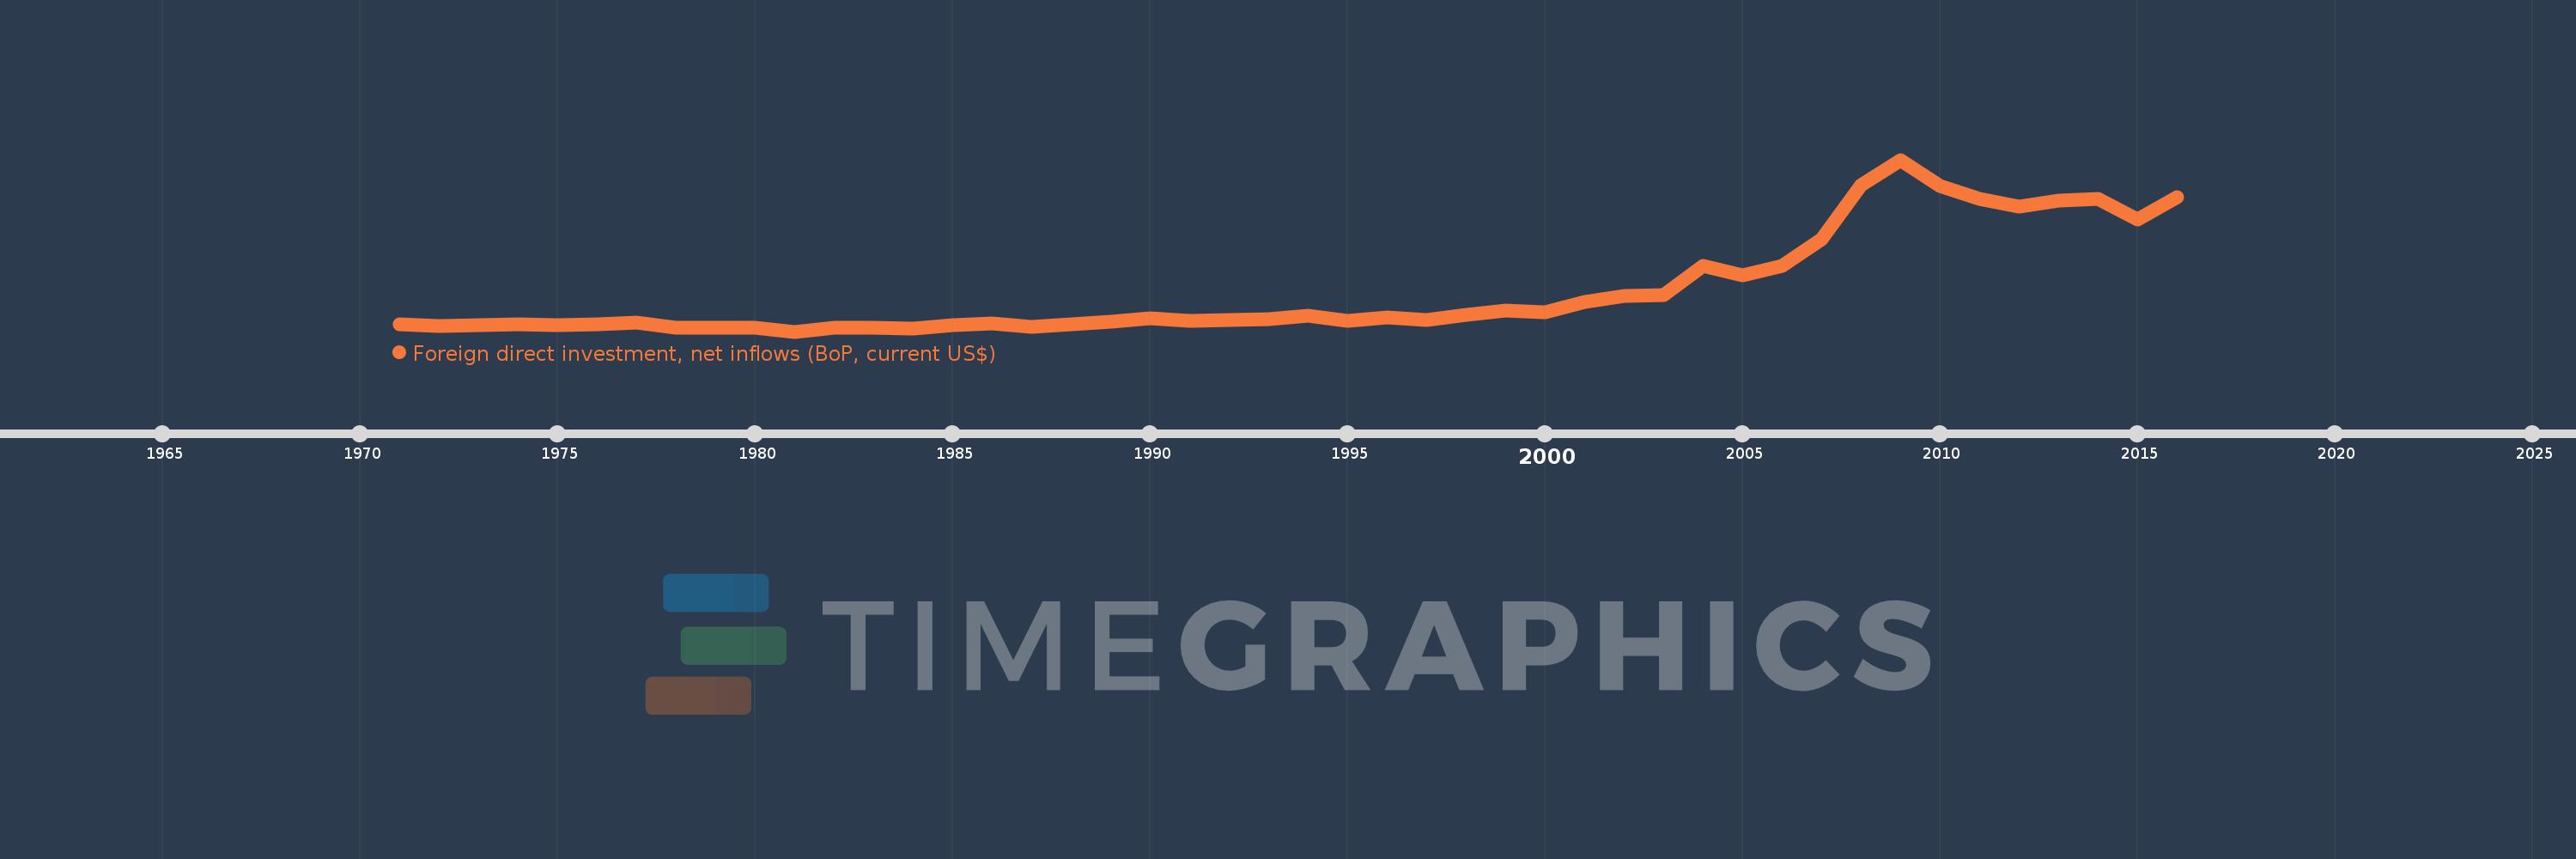
Foreign direct investment, net inflows (BoP, current US$)
2016,2015,2014,2013,2012,2011,2010,2009,2008,2007,2006,2005,2004,2003,2002,2001,2000,1999,1998,1997,1996,1995,1994,1993,1992,1991,1990,1989,1988,1987,1986,1985,1984,1983,1982,1981,1980,1979,1978,1977,1976,1975,1974,1973,1972,1971
This statistics in other country:
AfghanistanAlbaniaAlgeriaAngolaAntigua and BarbudaArab WorldArgentinaArmeniaArubaAustraliaAustriaAzerbaijanBahamas, TheBahrainBangladeshBarbadosBelarusBelgiumBelizeBeninBermudaBhutanBoliviaBosnia and HerzegovinaBotswanaBrazilBritish Virgin IslandsBrunei DarussalamBulgariaBurkina FasoBurundiCabo VerdeCambodiaCameroonCanadaCaribbean small statesCayman IslandsCentral African RepublicCentral Europe and the BalticsChadChileChinaColombiaComorosCongo, Dem. Rep.Congo, Rep.Costa RicaCote d'IvoireCroatiaCuracaoCyprusCzech RepublicDenmarkDjiboutiDominicaDominican RepublicEarly-demographic dividendEast Asia & PacificEast Asia & Pacific (excluding high income)East Asia & Pacific (IDA & IBRD countries)EcuadorEgypt, Arab Rep.El SalvadorEquatorial GuineaEritreaEstoniaEthiopiaEuro areaEurope & Central AsiaEurope & Central Asia (excluding high income)Europe & Central Asia (IDA & IBRD countries)European UnionFijiFinlandFragile and conflict affected situationsFranceFrench PolynesiaGabonGambia, TheGeorgiaGermanyGhanaGibraltarGreeceGrenadaGuatemalaGuineaGuinea-BissauGuyanaHaitiHeavily indebted poor countries (HIPC)High incomeHondurasHong Kong SAR, ChinaHungaryIBRD onlyIcelandIDA & IBRD totalIDA blendIDA onlyIDA totalIndiaIndonesiaIran, Islamic Rep.IraqIrelandIsraelItalyJamaicaJapanJordanKazakhstanKenyaKiribatiKorea, Dem. People’s Rep.Korea, Rep.KosovoKuwaitKyrgyz RepublicLao PDRLate-demographic dividendLatin America & Caribbean Latin America & Caribbean (excluding high income)Latin America & the Caribbean (IDA & IBRD countries)LatviaLeast developed countries: UN classificationLebanonLesothoLiberiaLibyaLithuaniaLow & middle incomeLow incomeLower middle incomeLuxembourgMacao SAR, ChinaMacedonia, FYRMadagascarMalawiMalaysiaMaldivesMaliMaltaMarshall IslandsMauritaniaMauritiusMexicoMicronesia, Fed. Sts.Middle East & North AfricaMiddle East & North Africa (excluding high income)Middle East & North Africa (IDA & IBRD countries)Middle incomeMoldovaMongoliaMontenegroMoroccoMozambiqueMyanmarNamibiaNauruNepalNetherlandsNew CaledoniaNew ZealandNicaraguaNigerNigeriaNorth AmericaNorthern Mariana IslandsNorwayOECD membersOmanOther small statesPacific island small statesPakistanPalauPanamaPapua New GuineaParaguayPeruPhilippinesPolandPortugalPost-demographic dividendPre-demographic dividendQatarRomaniaRussian FederationRwandaSamoaSao Tome and PrincipeSaudi ArabiaSenegalSerbiaSeychellesSierra LeoneSingaporeSint Maarten (Dutch part)Slovak RepublicSloveniaSmall statesSolomon IslandsSomaliaSouth AfricaSouth AsiaSouth Asia (IDA & IBRD)South SudanSpainSri LankaSt. Kitts and NevisSt. LuciaSt. Vincent and the GrenadinesSub-Saharan Africa Sub-Saharan Africa (excluding high income)Sub-Saharan Africa (IDA & IBRD countries)SudanSurinameSwazilandSwedenSwitzerlandSyrian Arab RepublicTajikistanTanzaniaThailandTimor-LesteTogoTongaTrinidad and TobagoTunisiaTurkeyTurkmenistanTuvaluUgandaUkraineUnited Arab EmiratesUnited KingdomUnited StatesUpper middle incomeUruguayUzbekistanVanuatuVenezuela, RBVietnamWest Bank and GazaWorldYemen, Rep.ZambiaZimbabwe Timeline:
This timeline shows a graph from 1971 to 2016 of Fragile and conflict affected situations. No data until 1970. Number of actual observations by date: 46.
Source name:
World Development Indicators
Source organization:
International Monetary Fund, Balance of Payments database, supplemented by data from the United Nations Conference on Trade and Development and official national sources.
Categories, topics:
Economy & Growth, Financial Sector, External Debt
Last updated:
apr 23, 2017
Indicators value changes by year
Minimum:
-670.131 mln
jan 1, 1981
Maximum:
21.556 bln
jan 1, 2009
At the date of observation
Value
Absolute change
Change from previous value
jan 1, 1971
235.47 mln
+235.47 mln
0.0%
jan 1, 1972
52.04 mln
-183.43 mln
-77.9%
jan 1, 1973
169.2 mln
+117.16 mln
225.13%
jan 1, 1974
255.035 mln
+85.835 mln
50.73%
jan 1, 1975
195.092 mln
-59.943 mln
-23.5%
jan 1, 1976
289.71 mln
+94.619 mln
48.5%
jan 1, 1977
456.577 mln
+166.867 mln
57.6%
jan 1, 1978
-164.253 mln
-620.83 mln
-135.97%
jan 1, 1979
-159.491 mln
+4.762 mln
-2.9%
jan 1, 1980
-169.39 mln
-9.899 mln
6.21%
jan 1, 1981
-670.131 mln
-500.741 mln
295.61%
jan 1, 1982
-203.186 mln
+466.944 mln
-69.68%
jan 1, 1983
-168.42 mln
+34.766 mln
-17.11%
jan 1, 1984
-274.953 mln
-106.533 mln
63.25%
jan 1, 1985
147.965 mln
+422.918 mln
-153.81%
jan 1, 1986
351.19 mln
+203.225 mln
137.35%
jan 1, 1987
-85.684 mln
-436.874 mln
-124.4%
jan 1, 1988
236.023 mln
+321.707 mln
-375.46%
jan 1, 1989
573.379 mln
+337.355 mln
142.93%
jan 1, 1990
1.101 bln
+527.27 mln
91.96%
jan 1, 1991
733.199 mln
-367.45 mln
-33.38%
jan 1, 1992
879.733 mln
+146.535 mln
19.99%
jan 1, 1993
930.254 mln
+50.52 mln
5.74%
jan 1, 1994
1.351 bln
+420.848 mln
45.24%
jan 1, 1995
684.578 mln
-666.524 mln
-49.33%
jan 1, 1996
1.195 bln
+510.145 mln
74.52%
jan 1, 1997
875.598 mln
-319.125 mln
-26.71%
jan 1, 1998
1.526 bln
+650.24 mln
74.26%
jan 1, 1999
2.097 bln
+571.311 mln
37.44%
jan 1, 2000
1.849 bln
-248.559 mln
-11.85%
jan 1, 2001
3.169 bln
+1.321 bln
71.45%
jan 1, 2002
3.98 bln
+810.373 mln
25.57%
jan 1, 2003
4.089 bln
+109.319 mln
2.75%
jan 1, 2004
7.86 bln
+3.771 bln
92.22%
jan 1, 2005
6.649 bln
-1.211 bln
-15.41%
jan 1, 2006
7.832 bln
+1.183 bln
17.8%
jan 1, 2007
11.271 bln
+3.439 bln
43.91%
jan 1, 2008
18.276 bln
+7.005 bln
62.15%
jan 1, 2009
21.556 bln
+3.28 bln
17.95%
jan 1, 2010
18.204 bln
-3.353 bln
-15.55%
jan 1, 2011
16.45 bln
-1.754 bln
-9.63%
jan 1, 2012
15.544 bln
-905.575 mln
-5.51%
jan 1, 2013
16.248 bln
+703.52 mln
4.53%
jan 1, 2014
16.445 bln
+197.314 mln
1.21%
jan 1, 2015
13.824 bln
-2.621 bln
-15.94%
jan 1, 2016
16.669 bln
+2.845 bln
20.58%
Ranking of countries by current statistics by years


Comments: