29
/
en
AIzaSyAYiBZKx7MnpbEhh9jyipgxe19OcubqV5w
April 1, 2024
199123
Mongolia
MNG
true
2
1
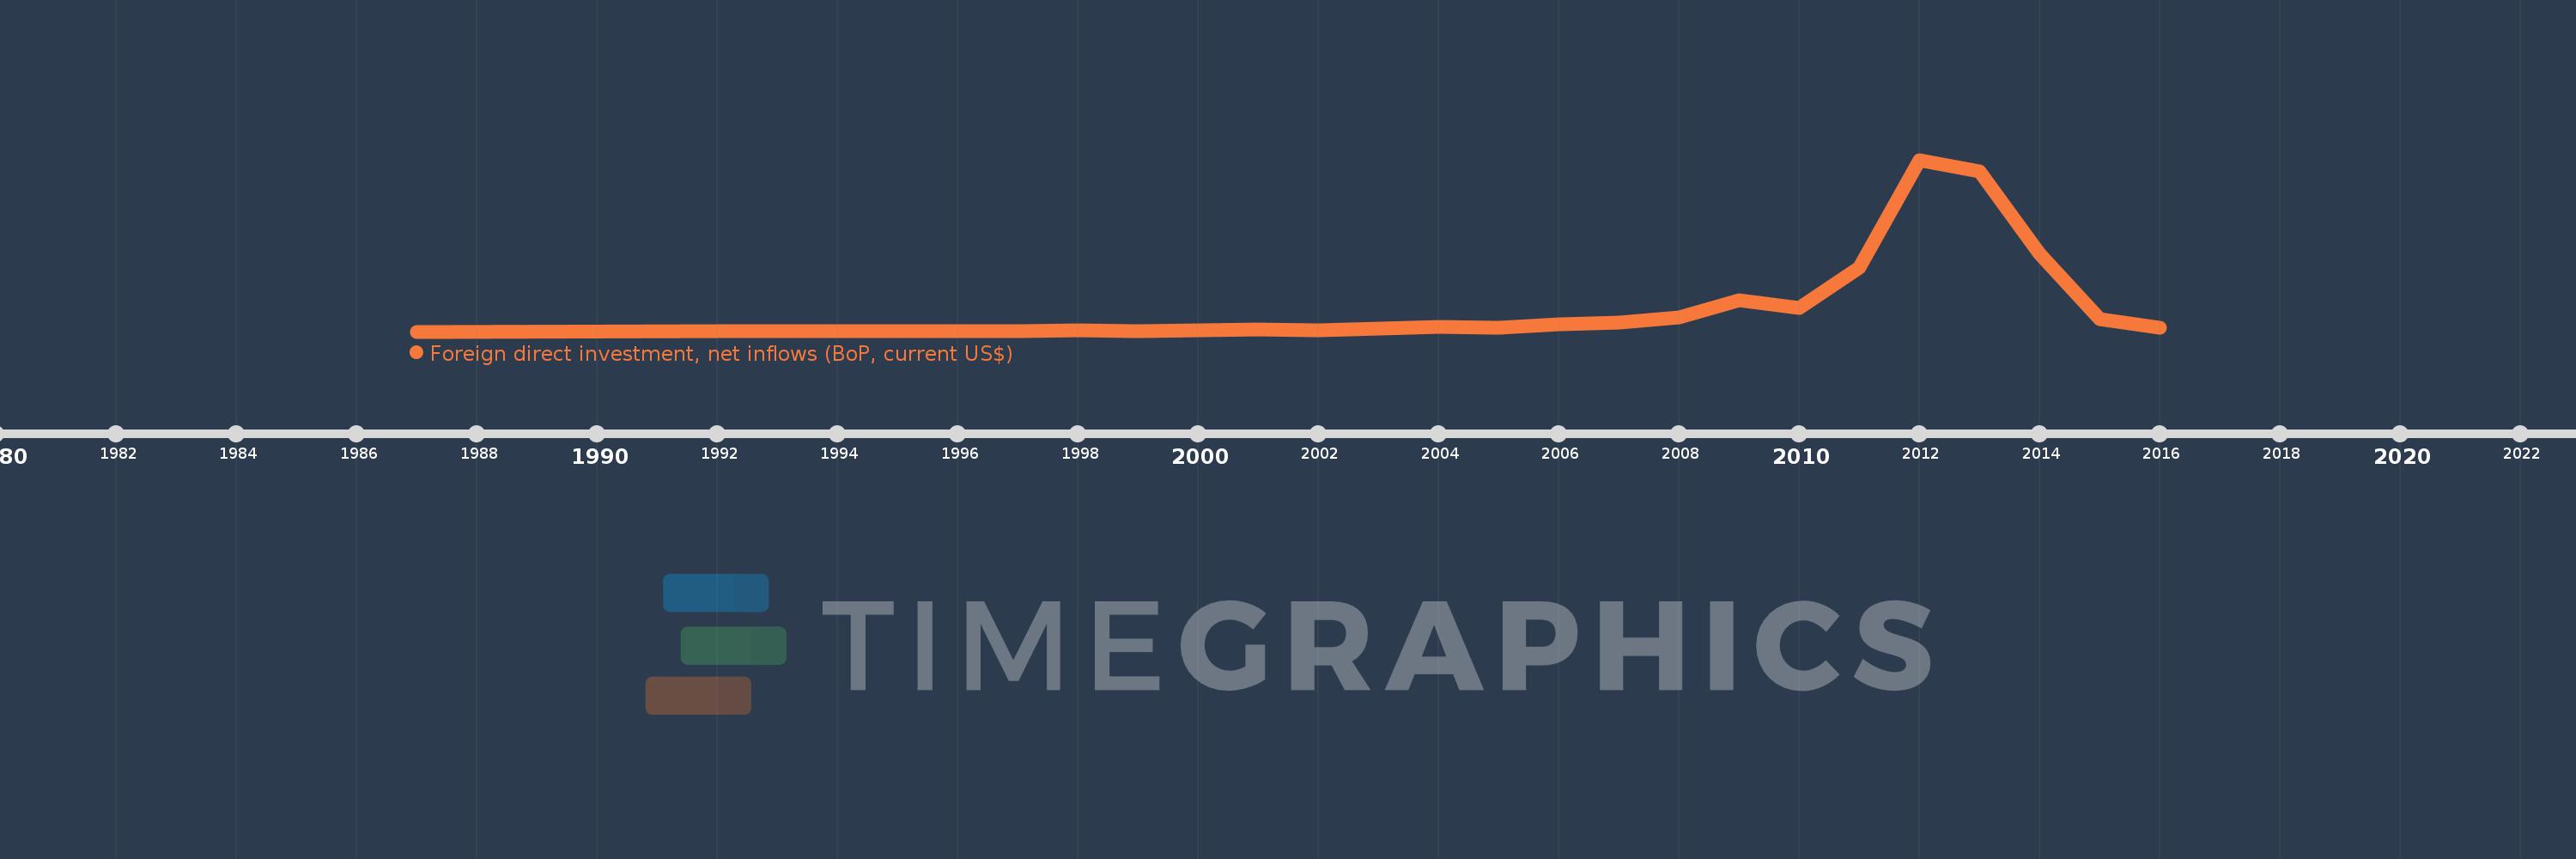
Foreign direct investment, net inflows (BoP, current US$)
2016,2015,2014,2013,2012,2011,2010,2009,2008,2007,2006,2005,2004,2003,2002,2001,2000,1999,1998,1997,1996,1995,1994,1993,1992,1987
This statistics in other country:
AfghanistanAlbaniaAlgeriaAngolaAntigua and BarbudaArab WorldArgentinaArmeniaArubaAustraliaAustriaAzerbaijanBahamas, TheBahrainBangladeshBarbadosBelarusBelgiumBelizeBeninBermudaBhutanBoliviaBosnia and HerzegovinaBotswanaBrazilBritish Virgin IslandsBrunei DarussalamBulgariaBurkina FasoBurundiCabo VerdeCambodiaCameroonCanadaCaribbean small statesCayman IslandsCentral African RepublicCentral Europe and the BalticsChadChileChinaColombiaComorosCongo, Dem. Rep.Congo, Rep.Costa RicaCote d'IvoireCroatiaCuracaoCyprusCzech RepublicDenmarkDjiboutiDominicaDominican RepublicEarly-demographic dividendEast Asia & PacificEast Asia & Pacific (excluding high income)East Asia & Pacific (IDA & IBRD countries)EcuadorEgypt, Arab Rep.El SalvadorEquatorial GuineaEritreaEstoniaEthiopiaEuro areaEurope & Central AsiaEurope & Central Asia (excluding high income)Europe & Central Asia (IDA & IBRD countries)European UnionFijiFinlandFragile and conflict affected situationsFranceFrench PolynesiaGabonGambia, TheGeorgiaGermanyGhanaGibraltarGreeceGrenadaGuatemalaGuineaGuinea-BissauGuyanaHaitiHeavily indebted poor countries (HIPC)High incomeHondurasHong Kong SAR, ChinaHungaryIBRD onlyIcelandIDA & IBRD totalIDA blendIDA onlyIDA totalIndiaIndonesiaIran, Islamic Rep.IraqIrelandIsraelItalyJamaicaJapanJordanKazakhstanKenyaKiribatiKorea, Dem. People’s Rep.Korea, Rep.KosovoKuwaitKyrgyz RepublicLao PDRLate-demographic dividendLatin America & Caribbean Latin America & Caribbean (excluding high income)Latin America & the Caribbean (IDA & IBRD countries)LatviaLeast developed countries: UN classificationLebanonLesothoLiberiaLibyaLithuaniaLow & middle incomeLow incomeLower middle incomeLuxembourgMacao SAR, ChinaMacedonia, FYRMadagascarMalawiMalaysiaMaldivesMaliMaltaMarshall IslandsMauritaniaMauritiusMexicoMicronesia, Fed. Sts.Middle East & North AfricaMiddle East & North Africa (excluding high income)Middle East & North Africa (IDA & IBRD countries)Middle incomeMoldovaMongoliaMontenegroMoroccoMozambiqueMyanmarNamibiaNauruNepalNetherlandsNew CaledoniaNew ZealandNicaraguaNigerNigeriaNorth AmericaNorthern Mariana IslandsNorwayOECD membersOmanOther small statesPacific island small statesPakistanPalauPanamaPapua New GuineaParaguayPeruPhilippinesPolandPortugalPost-demographic dividendPre-demographic dividendQatarRomaniaRussian FederationRwandaSamoaSao Tome and PrincipeSaudi ArabiaSenegalSerbiaSeychellesSierra LeoneSingaporeSint Maarten (Dutch part)Slovak RepublicSloveniaSmall statesSolomon IslandsSomaliaSouth AfricaSouth AsiaSouth Asia (IDA & IBRD)South SudanSpainSri LankaSt. Kitts and NevisSt. LuciaSt. Vincent and the GrenadinesSub-Saharan Africa Sub-Saharan Africa (excluding high income)Sub-Saharan Africa (IDA & IBRD countries)SudanSurinameSwazilandSwedenSwitzerlandSyrian Arab RepublicTajikistanTanzaniaThailandTimor-LesteTogoTongaTrinidad and TobagoTunisiaTurkeyTurkmenistanTuvaluUgandaUkraineUnited Arab EmiratesUnited KingdomUnited StatesUpper middle incomeUruguayUzbekistanVanuatuVenezuela, RBVietnamWest Bank and GazaWorldYemen, Rep.ZambiaZimbabwe Timeline:
This timeline shows a graph from 1987 to 2016 of Mongolia. No data until 1986. Number of actual observations by date: 26.
Source name:
World Development Indicators
Source organization:
International Monetary Fund, Balance of Payments database, supplemented by data from the United Nations Conference on Trade and Development and official national sources.
Categories, topics:
Economy & Growth, Financial Sector, External Debt
Last updated:
apr 23, 2017
Indicators value changes by year
Minimum:
140.0K
jan 1, 1987
Maximum:
4.571 bln
jan 1, 2012
At the date of observation
Value
Absolute change
Change from previous value
jan 1, 1987
140.0K
+140.0K
0.0%
jan 1, 1992
11.12 mln
+10.98 mln
7.84K%
jan 1, 1993
2.0 mln
-9.12 mln
-82.01%
jan 1, 1994
7.7 mln
+5.7 mln
285.0%
jan 1, 1995
6.9 mln
-800.0K
-10.39%
jan 1, 1996
9.8 mln
+2.9 mln
42.03%
jan 1, 1997
15.9 mln
+6.1 mln
62.24%
jan 1, 1998
25.0 mln
+9.1 mln
57.23%
jan 1, 1999
18.9 mln
-6.1 mln
-24.4%
jan 1, 2000
30.4 mln
+11.5 mln
60.85%
jan 1, 2001
53.7 mln
+23.3 mln
76.64%
jan 1, 2002
43.0 mln
-10.7 mln
-19.93%
jan 1, 2003
77.794 mln
+34.794 mln
80.92%
jan 1, 2004
131.5 mln
+53.706 mln
69.04%
jan 1, 2005
92.9 mln
-38.6 mln
-29.35%
jan 1, 2006
187.62 mln
+94.72 mln
101.96%
jan 1, 2007
245.46 mln
+57.84 mln
30.83%
jan 1, 2008
372.76 mln
+127.3 mln
51.86%
jan 1, 2009
844.698 mln
+471.938 mln
126.61%
jan 1, 2010
623.609 mln
-221.089 mln
-26.17%
jan 1, 2011
1.691 bln
+1.068 bln
171.23%
jan 1, 2012
4.571 bln
+2.88 bln
170.26%
jan 1, 2013
4.272 bln
-298.689 mln
-6.53%
jan 1, 2014
2.06 bln
-2.213 bln
-51.79%
jan 1, 2015
337.768 mln
-1.722 bln
-83.6%
jan 1, 2016
94.32 mln
-243.449 mln
-72.08%
Ranking of countries by current statistics by years


Comments: