29
/
en
AIzaSyAYiBZKx7MnpbEhh9jyipgxe19OcubqV5w
April 1, 2024
45071
Low & middle income
LMY
false
2
1
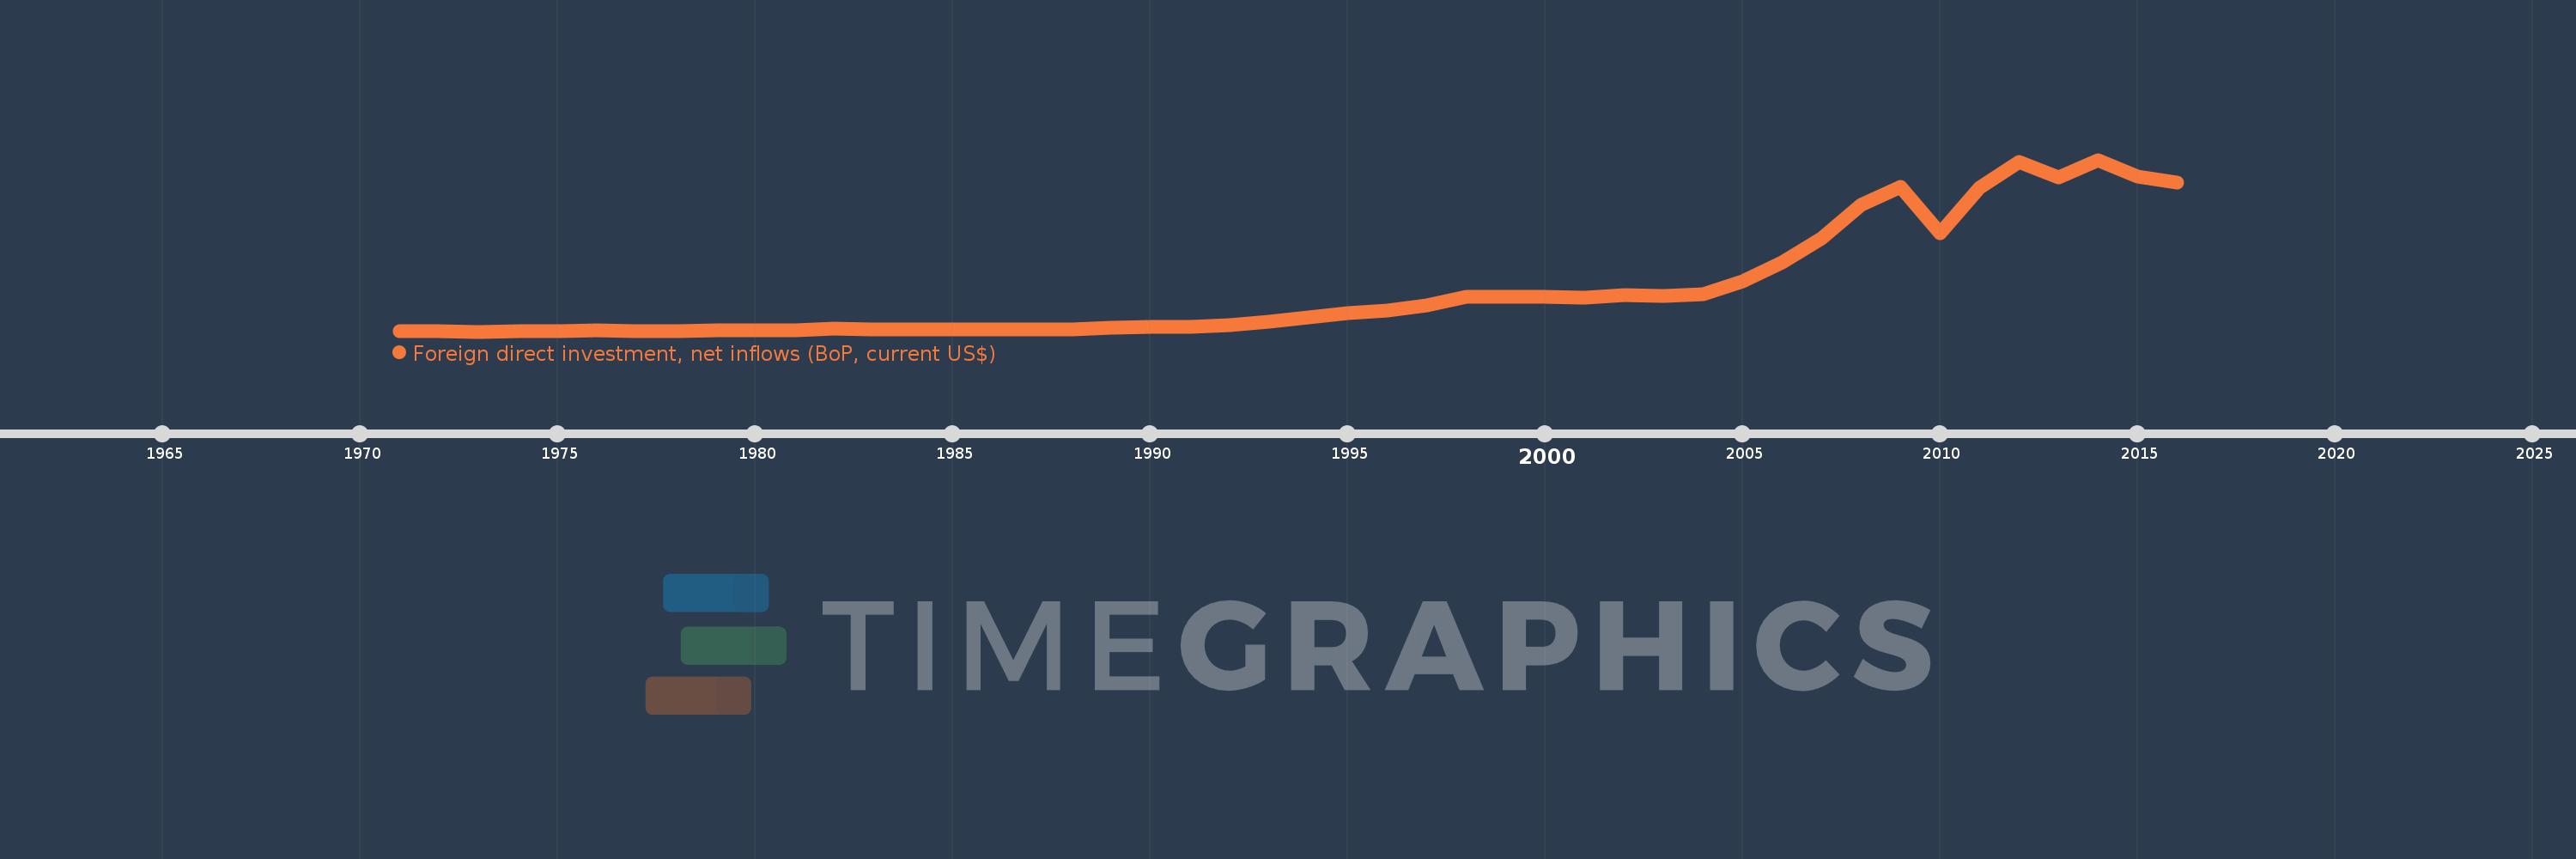
Foreign direct investment, net inflows (BoP, current US$)
2016,2015,2014,2013,2012,2011,2010,2009,2008,2007,2006,2005,2004,2003,2002,2001,2000,1999,1998,1997,1996,1995,1994,1993,1992,1991,1990,1989,1988,1987,1986,1985,1984,1983,1982,1981,1980,1979,1978,1977,1976,1975,1974,1973,1972,1971
This statistics in other country:
AfghanistanAlbaniaAlgeriaAngolaAntigua and BarbudaArab WorldArgentinaArmeniaArubaAustraliaAustriaAzerbaijanBahamas, TheBahrainBangladeshBarbadosBelarusBelgiumBelizeBeninBermudaBhutanBoliviaBosnia and HerzegovinaBotswanaBrazilBritish Virgin IslandsBrunei DarussalamBulgariaBurkina FasoBurundiCabo VerdeCambodiaCameroonCanadaCaribbean small statesCayman IslandsCentral African RepublicCentral Europe and the BalticsChadChileChinaColombiaComorosCongo, Dem. Rep.Congo, Rep.Costa RicaCote d'IvoireCroatiaCuracaoCyprusCzech RepublicDenmarkDjiboutiDominicaDominican RepublicEarly-demographic dividendEast Asia & PacificEast Asia & Pacific (excluding high income)East Asia & Pacific (IDA & IBRD countries)EcuadorEgypt, Arab Rep.El SalvadorEquatorial GuineaEritreaEstoniaEthiopiaEuro areaEurope & Central AsiaEurope & Central Asia (excluding high income)Europe & Central Asia (IDA & IBRD countries)European UnionFijiFinlandFragile and conflict affected situationsFranceFrench PolynesiaGabonGambia, TheGeorgiaGermanyGhanaGibraltarGreeceGrenadaGuatemalaGuineaGuinea-BissauGuyanaHaitiHeavily indebted poor countries (HIPC)High incomeHondurasHong Kong SAR, ChinaHungaryIBRD onlyIcelandIDA & IBRD totalIDA blendIDA onlyIDA totalIndiaIndonesiaIran, Islamic Rep.IraqIrelandIsraelItalyJamaicaJapanJordanKazakhstanKenyaKiribatiKorea, Dem. People’s Rep.Korea, Rep.KosovoKuwaitKyrgyz RepublicLao PDRLate-demographic dividendLatin America & Caribbean Latin America & Caribbean (excluding high income)Latin America & the Caribbean (IDA & IBRD countries)LatviaLeast developed countries: UN classificationLebanonLesothoLiberiaLibyaLithuaniaLow & middle incomeLow incomeLower middle incomeLuxembourgMacao SAR, ChinaMacedonia, FYRMadagascarMalawiMalaysiaMaldivesMaliMaltaMarshall IslandsMauritaniaMauritiusMexicoMicronesia, Fed. Sts.Middle East & North AfricaMiddle East & North Africa (excluding high income)Middle East & North Africa (IDA & IBRD countries)Middle incomeMoldovaMongoliaMontenegroMoroccoMozambiqueMyanmarNamibiaNauruNepalNetherlandsNew CaledoniaNew ZealandNicaraguaNigerNigeriaNorth AmericaNorthern Mariana IslandsNorwayOECD membersOmanOther small statesPacific island small statesPakistanPalauPanamaPapua New GuineaParaguayPeruPhilippinesPolandPortugalPost-demographic dividendPre-demographic dividendQatarRomaniaRussian FederationRwandaSamoaSao Tome and PrincipeSaudi ArabiaSenegalSerbiaSeychellesSierra LeoneSingaporeSint Maarten (Dutch part)Slovak RepublicSloveniaSmall statesSolomon IslandsSomaliaSouth AfricaSouth AsiaSouth Asia (IDA & IBRD)South SudanSpainSri LankaSt. Kitts and NevisSt. LuciaSt. Vincent and the GrenadinesSub-Saharan Africa Sub-Saharan Africa (excluding high income)Sub-Saharan Africa (IDA & IBRD countries)SudanSurinameSwazilandSwedenSwitzerlandSyrian Arab RepublicTajikistanTanzaniaThailandTimor-LesteTogoTongaTrinidad and TobagoTunisiaTurkeyTurkmenistanTuvaluUgandaUkraineUnited Arab EmiratesUnited KingdomUnited StatesUpper middle incomeUruguayUzbekistanVanuatuVenezuela, RBVietnamWest Bank and GazaWorldYemen, Rep.ZambiaZimbabwe Timeline:
This timeline shows a graph from 1971 to 2016 of Low & middle income. No data until 1970. Number of actual observations by date: 46.
Source name:
World Development Indicators
Source organization:
International Monetary Fund, Balance of Payments database, supplemented by data from the United Nations Conference on Trade and Development and official national sources.
Categories, topics:
Economy & Growth, Financial Sector, External Debt
Last updated:
apr 23, 2017
Indicators value changes by year
Minimum:
972.512 mln
jan 1, 1973
Maximum:
745.308 bln
jan 1, 2014
At the date of observation
Value
Absolute change
Change from previous value
jan 1, 1971
1.598 bln
+1.598 bln
0.0%
jan 1, 1972
1.626 bln
+27.511 mln
1.72%
jan 1, 1973
972.512 mln
-653.238 mln
-40.18%
jan 1, 1974
2.284 bln
+1.312 bln
134.88%
jan 1, 1975
3.057 bln
+773.052 mln
33.84%
jan 1, 1976
4.867 bln
+1.809 bln
59.18%
jan 1, 1977
3.65 bln
-1.217 bln
-25.01%
jan 1, 1978
4.603 bln
+953.265 mln
26.12%
jan 1, 1979
6.006 bln
+1.403 bln
30.49%
jan 1, 1980
7.249 bln
+1.243 bln
20.69%
jan 1, 1981
7.551 bln
+302.227 mln
4.17%
jan 1, 1982
12.352 bln
+4.801 bln
63.57%
jan 1, 1983
10.694 bln
-1.657 bln
-13.42%
jan 1, 1984
9.348 bln
-1.346 bln
-12.59%
jan 1, 1985
9.026 bln
-322.65 mln
-3.45%
jan 1, 1986
11.525 bln
+2.499 bln
27.69%
jan 1, 1987
9.151 bln
-2.374 bln
-20.6%
jan 1, 1988
9.281 bln
+130.14 mln
1.42%
jan 1, 1989
16.849 bln
+7.568 bln
81.54%
jan 1, 1990
20.965 bln
+4.116 bln
24.43%
jan 1, 1991
20.903 bln
-61.934 mln
-0.3%
jan 1, 1992
29.826 bln
+8.923 bln
42.69%
jan 1, 1993
42.382 bln
+12.556 bln
42.1%
jan 1, 1994
61.395 bln
+19.013 bln
44.86%
jan 1, 1995
81.504 bln
+20.109 bln
32.75%
jan 1, 1996
91.701 bln
+10.198 bln
12.51%
jan 1, 1997
113.19 bln
+21.489 bln
23.43%
jan 1, 1998
150.595 bln
+37.404 bln
33.05%
jan 1, 1999
150.677 bln
+81.964 mln
0.05%
jan 1, 2000
153.372 bln
+2.695 bln
1.79%
jan 1, 2001
146.812 bln
-6.559 bln
-4.28%
jan 1, 2002
159.318 bln
+12.506 bln
8.52%
jan 1, 2003
154.24 bln
-5.078 bln
-3.19%
jan 1, 2004
162.658 bln
+8.417 bln
5.46%
jan 1, 2005
217.736 bln
+55.078 bln
33.86%
jan 1, 2006
302.25 bln
+84.514 bln
38.81%
jan 1, 2007
405.112 bln
+102.862 bln
34.03%
jan 1, 2008
548.755 bln
+143.643 bln
35.46%
jan 1, 2009
627.469 bln
+78.714 bln
14.34%
jan 1, 2010
426.566 bln
-200.904 bln
-32.02%
jan 1, 2011
623.571 bln
+197.005 bln
46.18%
jan 1, 2012
735.132 bln
+111.561 bln
17.89%
jan 1, 2013
668.947 bln
-66.186 bln
-9.0%
jan 1, 2014
745.308 bln
+76.362 bln
11.42%
jan 1, 2015
674.065 bln
-71.244 bln
-9.56%
jan 1, 2016
647.779 bln
-26.285 bln
-3.9%
Ranking of countries by current statistics by years


Comments: