29
/
en
AIzaSyAYiBZKx7MnpbEhh9jyipgxe19OcubqV5w
April 1, 2024
262226
Thailand
THA
true
2
1
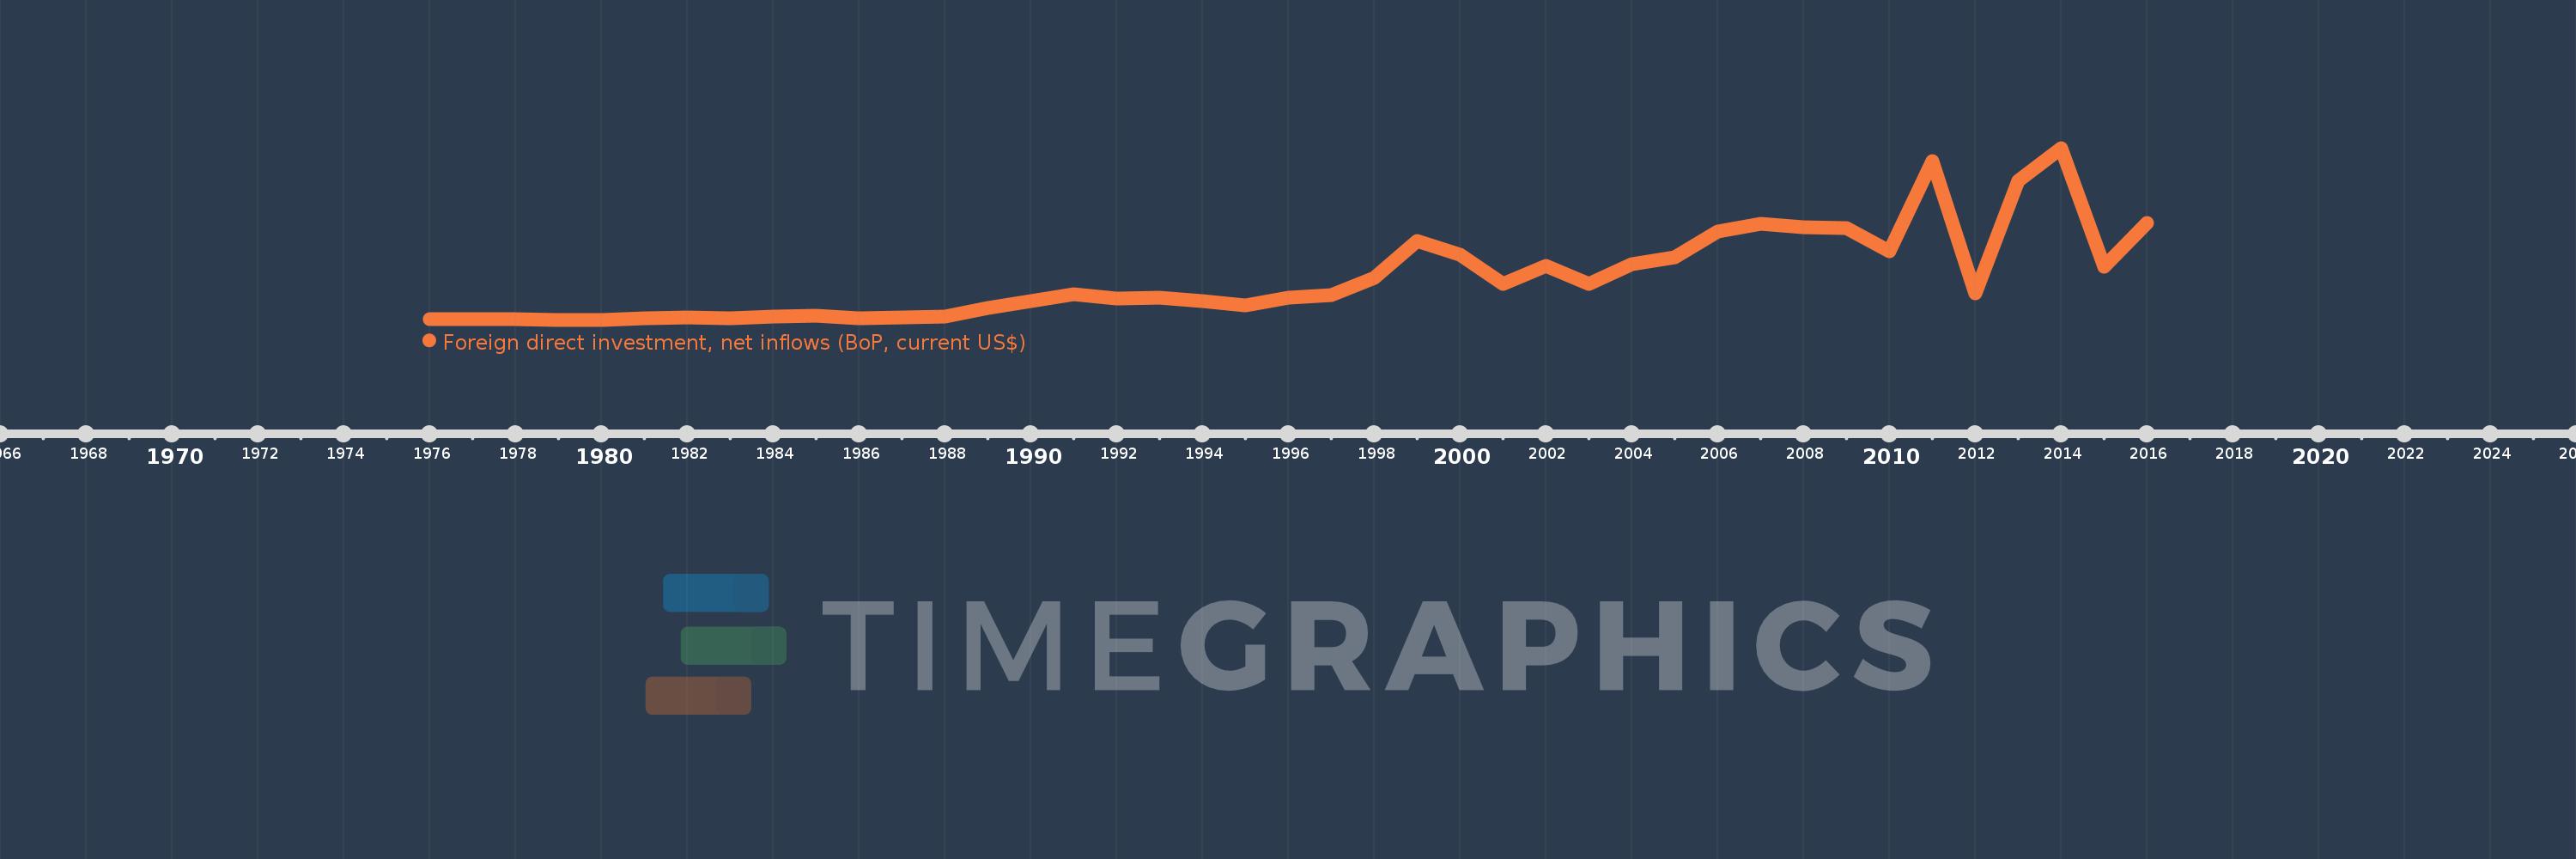
Foreign direct investment, net inflows (BoP, current US$)
2016,2015,2014,2013,2012,2011,2010,2009,2008,2007,2006,2005,2004,2003,2002,2001,2000,1999,1998,1997,1996,1995,1994,1993,1992,1991,1990,1989,1988,1987,1986,1985,1984,1983,1982,1981,1980,1979,1978,1977,1976
This statistics in other country:
AfghanistanAlbaniaAlgeriaAngolaAntigua and BarbudaArab WorldArgentinaArmeniaArubaAustraliaAustriaAzerbaijanBahamas, TheBahrainBangladeshBarbadosBelarusBelgiumBelizeBeninBermudaBhutanBoliviaBosnia and HerzegovinaBotswanaBrazilBritish Virgin IslandsBrunei DarussalamBulgariaBurkina FasoBurundiCabo VerdeCambodiaCameroonCanadaCaribbean small statesCayman IslandsCentral African RepublicCentral Europe and the BalticsChadChileChinaColombiaComorosCongo, Dem. Rep.Congo, Rep.Costa RicaCote d'IvoireCroatiaCuracaoCyprusCzech RepublicDenmarkDjiboutiDominicaDominican RepublicEarly-demographic dividendEast Asia & PacificEast Asia & Pacific (excluding high income)East Asia & Pacific (IDA & IBRD countries)EcuadorEgypt, Arab Rep.El SalvadorEquatorial GuineaEritreaEstoniaEthiopiaEuro areaEurope & Central AsiaEurope & Central Asia (excluding high income)Europe & Central Asia (IDA & IBRD countries)European UnionFijiFinlandFragile and conflict affected situationsFranceFrench PolynesiaGabonGambia, TheGeorgiaGermanyGhanaGibraltarGreeceGrenadaGuatemalaGuineaGuinea-BissauGuyanaHaitiHeavily indebted poor countries (HIPC)High incomeHondurasHong Kong SAR, ChinaHungaryIBRD onlyIcelandIDA & IBRD totalIDA blendIDA onlyIDA totalIndiaIndonesiaIran, Islamic Rep.IraqIrelandIsraelItalyJamaicaJapanJordanKazakhstanKenyaKiribatiKorea, Dem. People’s Rep.Korea, Rep.KosovoKuwaitKyrgyz RepublicLao PDRLate-demographic dividendLatin America & Caribbean Latin America & Caribbean (excluding high income)Latin America & the Caribbean (IDA & IBRD countries)LatviaLeast developed countries: UN classificationLebanonLesothoLiberiaLibyaLithuaniaLow & middle incomeLow incomeLower middle incomeLuxembourgMacao SAR, ChinaMacedonia, FYRMadagascarMalawiMalaysiaMaldivesMaliMaltaMarshall IslandsMauritaniaMauritiusMexicoMicronesia, Fed. Sts.Middle East & North AfricaMiddle East & North Africa (excluding high income)Middle East & North Africa (IDA & IBRD countries)Middle incomeMoldovaMongoliaMontenegroMoroccoMozambiqueMyanmarNamibiaNauruNepalNetherlandsNew CaledoniaNew ZealandNicaraguaNigerNigeriaNorth AmericaNorthern Mariana IslandsNorwayOECD membersOmanOther small statesPacific island small statesPakistanPalauPanamaPapua New GuineaParaguayPeruPhilippinesPolandPortugalPost-demographic dividendPre-demographic dividendQatarRomaniaRussian FederationRwandaSamoaSao Tome and PrincipeSaudi ArabiaSenegalSerbiaSeychellesSierra LeoneSingaporeSint Maarten (Dutch part)Slovak RepublicSloveniaSmall statesSolomon IslandsSomaliaSouth AfricaSouth AsiaSouth Asia (IDA & IBRD)South SudanSpainSri LankaSt. Kitts and NevisSt. LuciaSt. Vincent and the GrenadinesSub-Saharan Africa Sub-Saharan Africa (excluding high income)Sub-Saharan Africa (IDA & IBRD countries)SudanSurinameSwazilandSwedenSwitzerlandSyrian Arab RepublicTajikistanTanzaniaThailandTimor-LesteTogoTongaTrinidad and TobagoTunisiaTurkeyTurkmenistanTuvaluUgandaUkraineUnited Arab EmiratesUnited KingdomUnited StatesUpper middle incomeUruguayUzbekistanVanuatuVenezuela, RBVietnamWest Bank and GazaWorldYemen, Rep.ZambiaZimbabwe Timeline:
This timeline shows a graph from 1976 to 2016 of Thailand. No data until 1975. Number of actual observations by date: 41.
Source name:
World Development Indicators
Source organization:
International Monetary Fund, Balance of Payments database, supplemented by data from the United Nations Conference on Trade and Development and official national sources.
Categories, topics:
Economy & Growth, Financial Sector, External Debt
Last updated:
apr 23, 2017
Indicators value changes by year
Minimum:
55.281 mln
jan 1, 1980
Maximum:
15.936 bln
jan 1, 2014
At the date of observation
Value
Absolute change
Change from previous value
jan 1, 1976
85.626 mln
+85.626 mln
0.0%
jan 1, 1977
79.117 mln
-6.509 mln
-7.6%
jan 1, 1978
106.078 mln
+26.961 mln
34.08%
jan 1, 1979
55.653 mln
-50.425 mln
-47.54%
jan 1, 1980
55.281 mln
-372.345K
-0.67%
jan 1, 1981
189.859 mln
+134.579 mln
243.45%
jan 1, 1982
290.555 mln
+100.696 mln
53.04%
jan 1, 1983
190.869 mln
-99.687 mln
-34.31%
jan 1, 1984
349.607 mln
+158.738 mln
83.17%
jan 1, 1985
401.019 mln
+51.412 mln
14.71%
jan 1, 1986
163.201 mln
-237.819 mln
-59.3%
jan 1, 1987
262.504 mln
+99.303 mln
60.85%
jan 1, 1988
351.932 mln
+89.428 mln
34.07%
jan 1, 1989
1.105 bln
+753.438 mln
214.09%
jan 1, 1990
1.775 bln
+670.079 mln
60.62%
jan 1, 1991
2.444 bln
+668.1 mln
37.63%
jan 1, 1992
2.014 bln
-429.564 mln
-17.58%
jan 1, 1993
2.113 bln
+99.036 mln
4.92%
jan 1, 1994
1.804 bln
-308.981 mln
-14.62%
jan 1, 1995
1.366 bln
-437.6 mln
-24.26%
jan 1, 1996
2.068 bln
+701.496 mln
51.34%
jan 1, 1997
2.336 bln
+267.901 mln
12.95%
jan 1, 1998
3.895 bln
+1.559 bln
66.74%
jan 1, 1999
7.315 bln
+3.42 bln
87.81%
jan 1, 2000
6.103 bln
-1.212 bln
-16.57%
jan 1, 2001
3.366 bln
-2.737 bln
-44.84%
jan 1, 2002
5.067 bln
+1.701 bln
50.54%
jan 1, 2003
3.342 bln
-1.726 bln
-34.05%
jan 1, 2004
5.232 bln
+1.891 bln
56.58%
jan 1, 2005
5.86 bln
+627.986 mln
12.0%
jan 1, 2006
8.216 bln
+2.355 bln
40.19%
jan 1, 2007
8.917 bln
+701.833 mln
8.54%
jan 1, 2008
8.634 bln
-283.567 mln
-3.18%
jan 1, 2009
8.562 bln
-72.346 mln
-0.84%
jan 1, 2010
6.411 bln
-2.15 bln
-25.11%
jan 1, 2011
14.747 bln
+8.335 bln
130.0%
jan 1, 2012
2.474 bln
-12.273 bln
-83.23%
jan 1, 2013
12.899 bln
+10.425 bln
421.45%
jan 1, 2014
15.936 bln
+3.037 bln
23.54%
jan 1, 2015
4.975 bln
-10.961 bln
-68.78%
jan 1, 2016
9.004 bln
+4.028 bln
80.96%
Ranking of countries by current statistics by years


Comments: