29
/
en
AIzaSyAYiBZKx7MnpbEhh9jyipgxe19OcubqV5w
April 1, 2024
123477
Ecuador
ECU
true
2
1
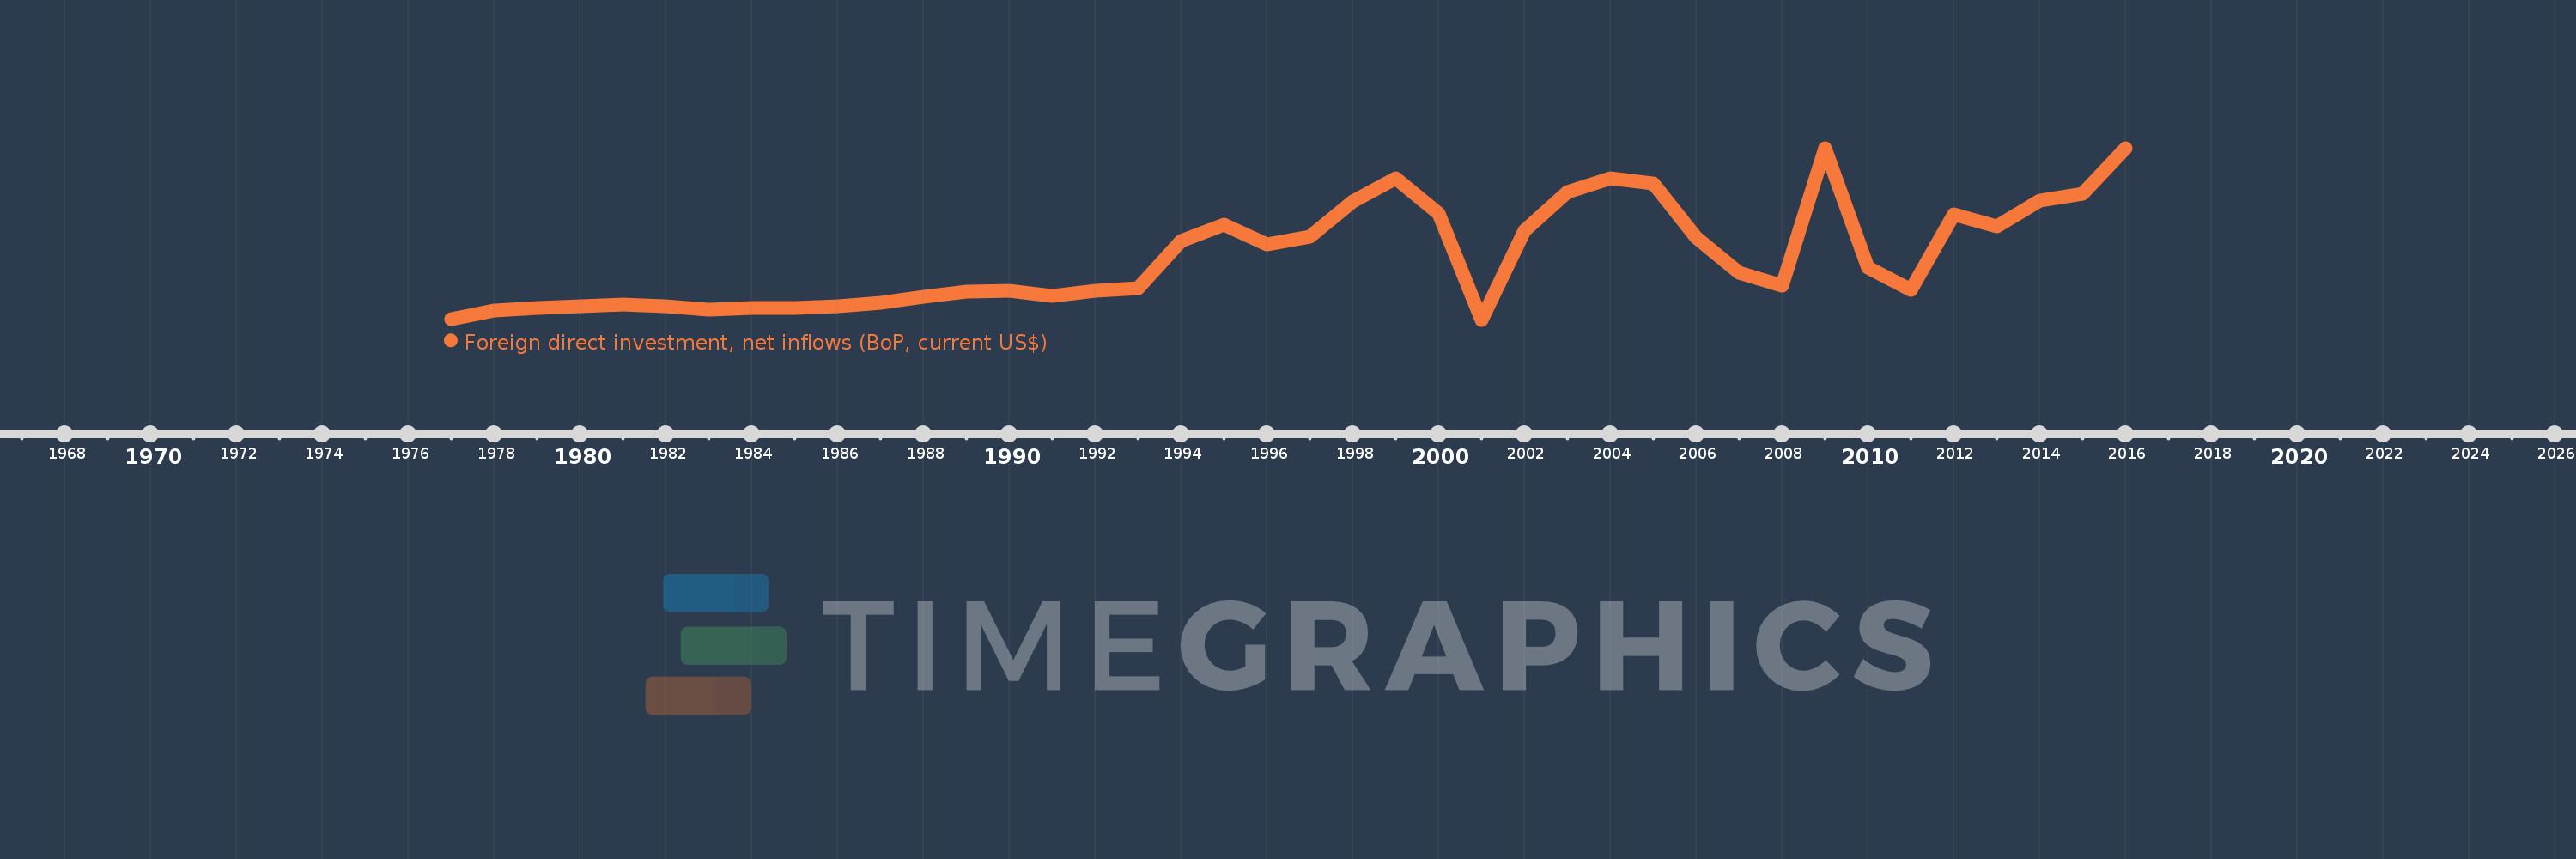
Foreign direct investment, net inflows (BoP, current US$)
2016,2015,2014,2013,2012,2011,2010,2009,2008,2007,2006,2005,2004,2003,2002,2001,2000,1999,1998,1997,1996,1995,1994,1993,1992,1991,1990,1989,1988,1987,1986,1985,1984,1983,1982,1981,1980,1979,1978,1977
This statistics in other country:
AfghanistanAlbaniaAlgeriaAngolaAntigua and BarbudaArab WorldArgentinaArmeniaArubaAustraliaAustriaAzerbaijanBahamas, TheBahrainBangladeshBarbadosBelarusBelgiumBelizeBeninBermudaBhutanBoliviaBosnia and HerzegovinaBotswanaBrazilBritish Virgin IslandsBrunei DarussalamBulgariaBurkina FasoBurundiCabo VerdeCambodiaCameroonCanadaCaribbean small statesCayman IslandsCentral African RepublicCentral Europe and the BalticsChadChileChinaColombiaComorosCongo, Dem. Rep.Congo, Rep.Costa RicaCote d'IvoireCroatiaCuracaoCyprusCzech RepublicDenmarkDjiboutiDominicaDominican RepublicEarly-demographic dividendEast Asia & PacificEast Asia & Pacific (excluding high income)East Asia & Pacific (IDA & IBRD countries)EcuadorEgypt, Arab Rep.El SalvadorEquatorial GuineaEritreaEstoniaEthiopiaEuro areaEurope & Central AsiaEurope & Central Asia (excluding high income)Europe & Central Asia (IDA & IBRD countries)European UnionFijiFinlandFragile and conflict affected situationsFranceFrench PolynesiaGabonGambia, TheGeorgiaGermanyGhanaGibraltarGreeceGrenadaGuatemalaGuineaGuinea-BissauGuyanaHaitiHeavily indebted poor countries (HIPC)High incomeHondurasHong Kong SAR, ChinaHungaryIBRD onlyIcelandIDA & IBRD totalIDA blendIDA onlyIDA totalIndiaIndonesiaIran, Islamic Rep.IraqIrelandIsraelItalyJamaicaJapanJordanKazakhstanKenyaKiribatiKorea, Dem. People’s Rep.Korea, Rep.KosovoKuwaitKyrgyz RepublicLao PDRLate-demographic dividendLatin America & Caribbean Latin America & Caribbean (excluding high income)Latin America & the Caribbean (IDA & IBRD countries)LatviaLeast developed countries: UN classificationLebanonLesothoLiberiaLibyaLithuaniaLow & middle incomeLow incomeLower middle incomeLuxembourgMacao SAR, ChinaMacedonia, FYRMadagascarMalawiMalaysiaMaldivesMaliMaltaMarshall IslandsMauritaniaMauritiusMexicoMicronesia, Fed. Sts.Middle East & North AfricaMiddle East & North Africa (excluding high income)Middle East & North Africa (IDA & IBRD countries)Middle incomeMoldovaMongoliaMontenegroMoroccoMozambiqueMyanmarNamibiaNauruNepalNetherlandsNew CaledoniaNew ZealandNicaraguaNigerNigeriaNorth AmericaNorthern Mariana IslandsNorwayOECD membersOmanOther small statesPacific island small statesPakistanPalauPanamaPapua New GuineaParaguayPeruPhilippinesPolandPortugalPost-demographic dividendPre-demographic dividendQatarRomaniaRussian FederationRwandaSamoaSao Tome and PrincipeSaudi ArabiaSenegalSerbiaSeychellesSierra LeoneSingaporeSint Maarten (Dutch part)Slovak RepublicSloveniaSmall statesSolomon IslandsSomaliaSouth AfricaSouth AsiaSouth Asia (IDA & IBRD)South SudanSpainSri LankaSt. Kitts and NevisSt. LuciaSt. Vincent and the GrenadinesSub-Saharan Africa Sub-Saharan Africa (excluding high income)Sub-Saharan Africa (IDA & IBRD countries)SudanSurinameSwazilandSwedenSwitzerlandSyrian Arab RepublicTajikistanTanzaniaThailandTimor-LesteTogoTongaTrinidad and TobagoTunisiaTurkeyTurkmenistanTuvaluUgandaUkraineUnited Arab EmiratesUnited KingdomUnited StatesUpper middle incomeUruguayUzbekistanVanuatuVenezuela, RBVietnamWest Bank and GazaWorldYemen, Rep.ZambiaZimbabwe Timeline:
This timeline shows a graph from 1977 to 2016 of Ecuador. No data until 1976. Number of actual observations by date: 40.
Source name:
World Development Indicators
Source organization:
International Monetary Fund, Balance of Payments database, supplemented by data from the United Nations Conference on Trade and Development and official national sources.
Categories, topics:
Economy & Growth, Financial Sector, External Debt
Last updated:
apr 23, 2017
Indicators value changes by year
Minimum:
-23.439 mln
jan 1, 2001
Maximum:
1.06 bln
jan 1, 2016
At the date of observation
Value
Absolute change
Change from previous value
jan 1, 1977
-19.9 mln
-19.9 mln
0.0%
jan 1, 1978
34.5 mln
+54.4 mln
-273.37%
jan 1, 1979
48.6 mln
+14.1 mln
40.87%
jan 1, 1980
63.4 mln
+14.8 mln
30.45%
jan 1, 1981
70.0 mln
+6.6 mln
10.41%
jan 1, 1982
60.0 mln
-10.0 mln
-14.29%
jan 1, 1983
40.0 mln
-20.0 mln
-33.33%
jan 1, 1984
50.0 mln
+10.0 mln
25.0%
jan 1, 1985
50.0 mln
0.0
0.0%
jan 1, 1986
62.0 mln
+12.0 mln
24.0%
jan 1, 1987
81.0 mln
+19.0 mln
30.65%
jan 1, 1988
123.0 mln
+42.0 mln
51.85%
jan 1, 1989
155.0 mln
+32.0 mln
26.02%
jan 1, 1990
160.0 mln
+5.0 mln
3.23%
jan 1, 1991
126.0 mln
-34.0 mln
-21.25%
jan 1, 1992
160.0 mln
+34.0 mln
26.98%
jan 1, 1993
178.0 mln
+18.0 mln
11.25%
jan 1, 1994
473.72 mln
+295.72 mln
166.13%
jan 1, 1995
576.33 mln
+102.61 mln
21.66%
jan 1, 1996
452.48 mln
-123.85 mln
-21.49%
jan 1, 1997
499.68 mln
+47.2 mln
10.43%
jan 1, 1998
723.95 mln
+224.27 mln
44.88%
jan 1, 1999
869.98 mln
+146.03 mln
20.17%
jan 1, 2000
648.41 mln
-221.57 mln
-25.47%
jan 1, 2001
-23.439 mln
-671.849 mln
-103.61%
jan 1, 2002
538.569 mln
+562.008 mln
-2.4K%
jan 1, 2003
783.261 mln
+244.692 mln
45.43%
jan 1, 2004
871.513 mln
+88.252 mln
11.27%
jan 1, 2005
836.94 mln
-34.574 mln
-3.97%
jan 1, 2006
493.414 mln
-343.526 mln
-41.05%
jan 1, 2007
271.429 mln
-221.985 mln
-44.99%
jan 1, 2008
193.873 mln
-77.556 mln
-28.57%
jan 1, 2009
1.057 bln
+863.015 mln
445.15%
jan 1, 2010
307.961 mln
-748.927 mln
-70.86%
jan 1, 2011
165.32 mln
-142.641 mln
-46.32%
jan 1, 2012
643.709 mln
+478.389 mln
289.37%
jan 1, 2013
567.035 mln
-76.674 mln
-11.91%
jan 1, 2014
726.814 mln
+159.779 mln
28.18%
jan 1, 2015
772.936 mln
+46.122 mln
6.35%
jan 1, 2016
1.06 bln
+287.127 mln
37.15%
Ranking of countries by current statistics by years


Comments: