29
/
en
AIzaSyAYiBZKx7MnpbEhh9jyipgxe19OcubqV5w
April 1, 2024
167475
Kenya
KEN
true
2
1
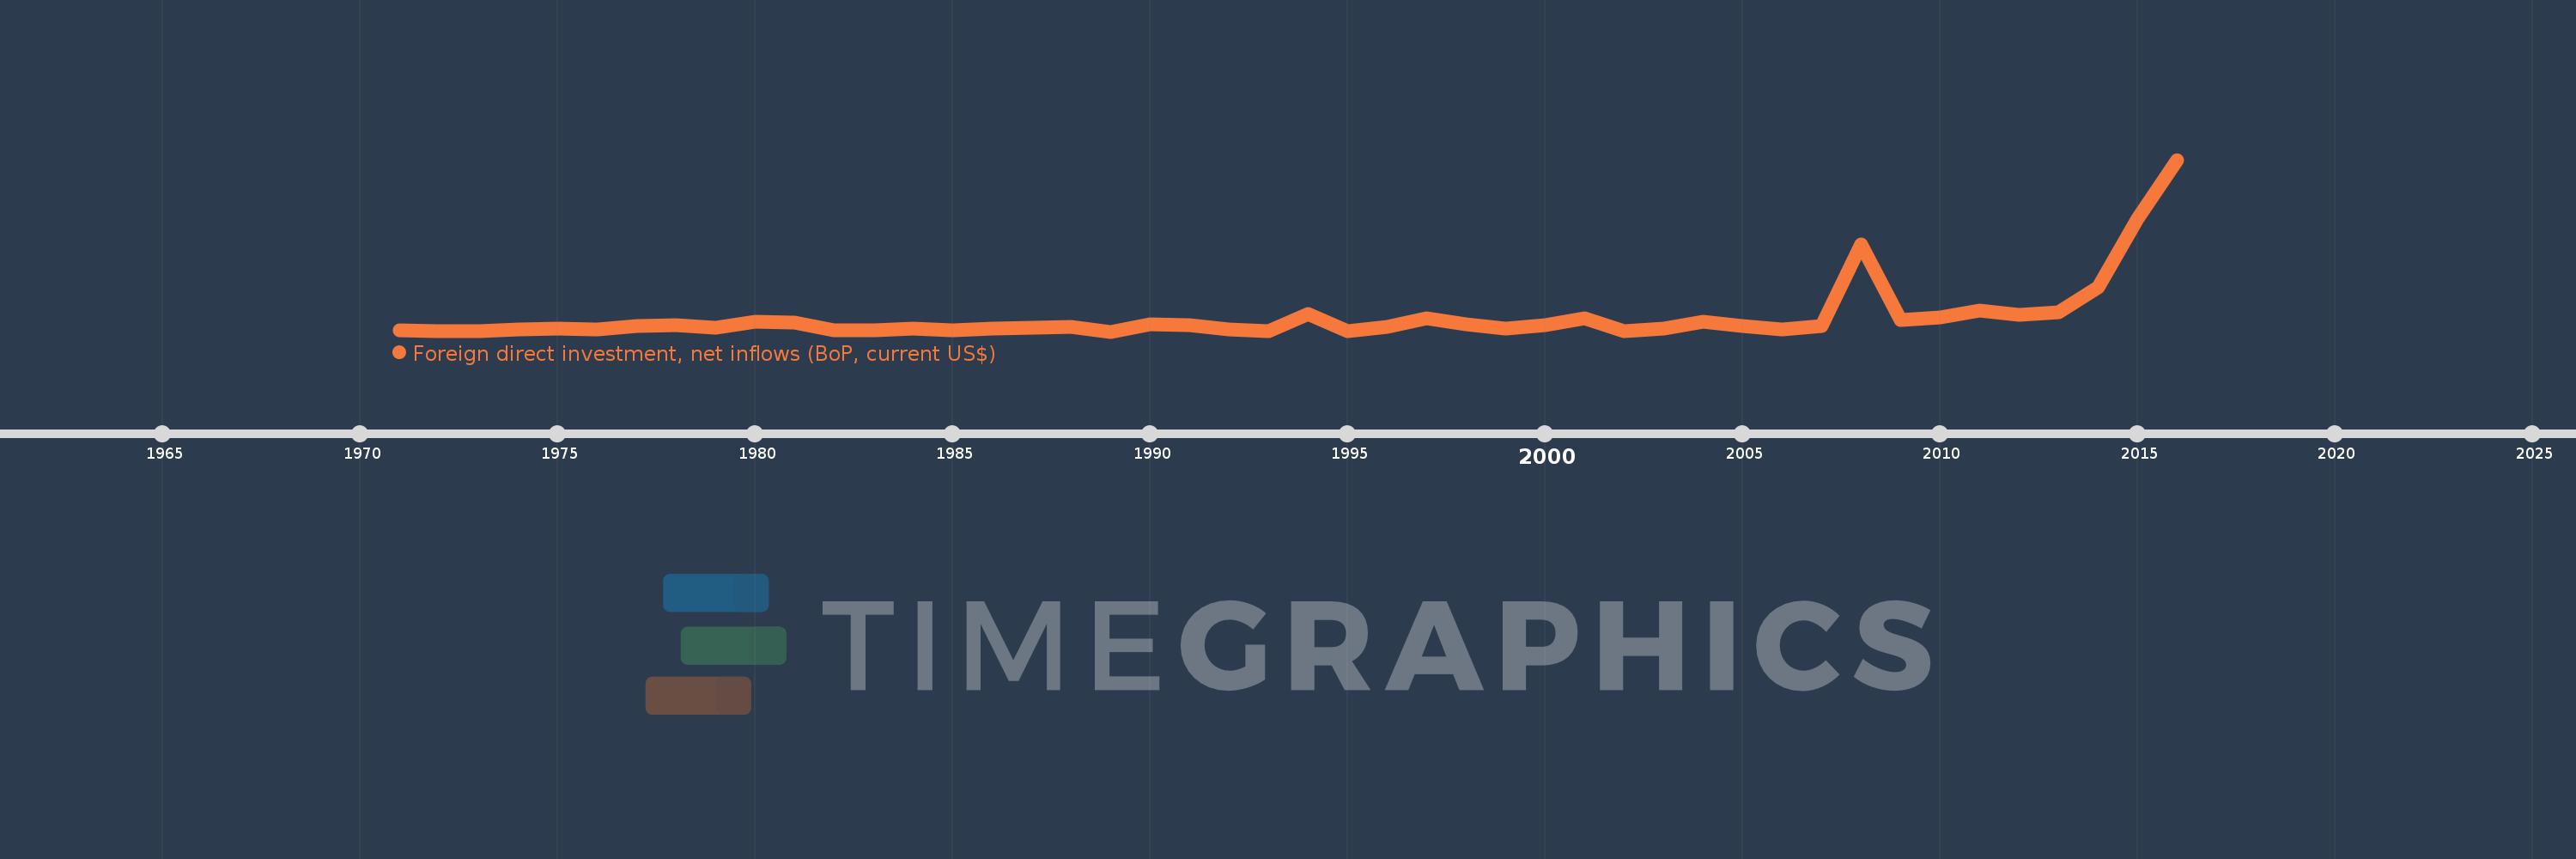
Foreign direct investment, net inflows (BoP, current US$)
2016,2015,2014,2013,2012,2011,2010,2009,2008,2007,2006,2005,2004,2003,2002,2001,2000,1999,1998,1997,1996,1995,1994,1993,1992,1991,1990,1989,1988,1987,1986,1985,1984,1983,1982,1981,1980,1979,1978,1977,1976,1975,1974,1973,1972,1971
This statistics in other country:
AfghanistanAlbaniaAlgeriaAngolaAntigua and BarbudaArab WorldArgentinaArmeniaArubaAustraliaAustriaAzerbaijanBahamas, TheBahrainBangladeshBarbadosBelarusBelgiumBelizeBeninBermudaBhutanBoliviaBosnia and HerzegovinaBotswanaBrazilBritish Virgin IslandsBrunei DarussalamBulgariaBurkina FasoBurundiCabo VerdeCambodiaCameroonCanadaCaribbean small statesCayman IslandsCentral African RepublicCentral Europe and the BalticsChadChileChinaColombiaComorosCongo, Dem. Rep.Congo, Rep.Costa RicaCote d'IvoireCroatiaCuracaoCyprusCzech RepublicDenmarkDjiboutiDominicaDominican RepublicEarly-demographic dividendEast Asia & PacificEast Asia & Pacific (excluding high income)East Asia & Pacific (IDA & IBRD countries)EcuadorEgypt, Arab Rep.El SalvadorEquatorial GuineaEritreaEstoniaEthiopiaEuro areaEurope & Central AsiaEurope & Central Asia (excluding high income)Europe & Central Asia (IDA & IBRD countries)European UnionFijiFinlandFragile and conflict affected situationsFranceFrench PolynesiaGabonGambia, TheGeorgiaGermanyGhanaGibraltarGreeceGrenadaGuatemalaGuineaGuinea-BissauGuyanaHaitiHeavily indebted poor countries (HIPC)High incomeHondurasHong Kong SAR, ChinaHungaryIBRD onlyIcelandIDA & IBRD totalIDA blendIDA onlyIDA totalIndiaIndonesiaIran, Islamic Rep.IraqIrelandIsraelItalyJamaicaJapanJordanKazakhstanKenyaKiribatiKorea, Dem. People’s Rep.Korea, Rep.KosovoKuwaitKyrgyz RepublicLao PDRLate-demographic dividendLatin America & Caribbean Latin America & Caribbean (excluding high income)Latin America & the Caribbean (IDA & IBRD countries)LatviaLeast developed countries: UN classificationLebanonLesothoLiberiaLibyaLithuaniaLow & middle incomeLow incomeLower middle incomeLuxembourgMacao SAR, ChinaMacedonia, FYRMadagascarMalawiMalaysiaMaldivesMaliMaltaMarshall IslandsMauritaniaMauritiusMexicoMicronesia, Fed. Sts.Middle East & North AfricaMiddle East & North Africa (excluding high income)Middle East & North Africa (IDA & IBRD countries)Middle incomeMoldovaMongoliaMontenegroMoroccoMozambiqueMyanmarNamibiaNauruNepalNetherlandsNew CaledoniaNew ZealandNicaraguaNigerNigeriaNorth AmericaNorthern Mariana IslandsNorwayOECD membersOmanOther small statesPacific island small statesPakistanPalauPanamaPapua New GuineaParaguayPeruPhilippinesPolandPortugalPost-demographic dividendPre-demographic dividendQatarRomaniaRussian FederationRwandaSamoaSao Tome and PrincipeSaudi ArabiaSenegalSerbiaSeychellesSierra LeoneSingaporeSint Maarten (Dutch part)Slovak RepublicSloveniaSmall statesSolomon IslandsSomaliaSouth AfricaSouth AsiaSouth Asia (IDA & IBRD)South SudanSpainSri LankaSt. Kitts and NevisSt. LuciaSt. Vincent and the GrenadinesSub-Saharan Africa Sub-Saharan Africa (excluding high income)Sub-Saharan Africa (IDA & IBRD countries)SudanSurinameSwazilandSwedenSwitzerlandSyrian Arab RepublicTajikistanTanzaniaThailandTimor-LesteTogoTongaTrinidad and TobagoTunisiaTurkeyTurkmenistanTuvaluUgandaUkraineUnited Arab EmiratesUnited KingdomUnited StatesUpper middle incomeUruguayUzbekistanVanuatuVenezuela, RBVietnamWest Bank and GazaWorldYemen, Rep.ZambiaZimbabwe Timeline:
This timeline shows a graph from 1971 to 2016 of Kenya. No data until 1970. Number of actual observations by date: 46.
Source name:
World Development Indicators
Source organization:
International Monetary Fund, Balance of Payments database, supplemented by data from the United Nations Conference on Trade and Development and official national sources.
Categories, topics:
Economy & Growth, Financial Sector, External Debt
Last updated:
apr 23, 2017
Indicators value changes by year
Minimum:
394.431K
jan 1, 1989
Maximum:
1.437 bln
jan 1, 2016
At the date of observation
Value
Absolute change
Change from previous value
jan 1, 1971
13.8 mln
+13.8 mln
0.0%
jan 1, 1972
7.4 mln
-6.4 mln
-46.38%
jan 1, 1973
6.3 mln
-1.1 mln
-14.86%
jan 1, 1974
17.26 mln
+10.96 mln
173.97%
jan 1, 1975
23.42 mln
+6.16 mln
35.69%
jan 1, 1976
17.159 mln
-6.261 mln
-26.73%
jan 1, 1977
46.372 mln
+29.213 mln
170.25%
jan 1, 1978
56.545 mln
+10.173 mln
21.94%
jan 1, 1979
34.414 mln
-22.131 mln
-39.14%
jan 1, 1980
84.01 mln
+49.596 mln
144.11%
jan 1, 1981
78.974 mln
-5.036 mln
-5.99%
jan 1, 1982
14.148 mln
-64.826 mln
-82.09%
jan 1, 1983
13.001 mln
-1.147 mln
-8.11%
jan 1, 1984
23.739 mln
+10.738 mln
82.59%
jan 1, 1985
10.754 mln
-12.985 mln
-54.7%
jan 1, 1986
28.846 mln
+18.092 mln
168.25%
jan 1, 1987
32.726 mln
+3.88 mln
13.45%
jan 1, 1988
39.381 mln
+6.656 mln
20.34%
jan 1, 1989
394.431K
-38.987 mln
-99.0%
jan 1, 1990
62.19 mln
+61.795 mln
15.67K%
jan 1, 1991
57.081 mln
-5.109 mln
-8.21%
jan 1, 1992
18.831 mln
-38.25 mln
-67.01%
jan 1, 1993
6.363 mln
-12.468 mln
-66.21%
jan 1, 1994
145.656 mln
+139.292 mln
2.19K%
jan 1, 1995
7.432 mln
-138.223 mln
-94.9%
jan 1, 1996
42.289 mln
+34.857 mln
468.98%
jan 1, 1997
108.673 mln
+66.384 mln
156.98%
jan 1, 1998
62.097 mln
-46.576 mln
-42.86%
jan 1, 1999
26.548 mln
-35.549 mln
-57.25%
jan 1, 2000
51.953 mln
+25.405 mln
95.69%
jan 1, 2001
110.905 mln
+58.951 mln
113.47%
jan 1, 2002
5.303 mln
-105.602 mln
-95.22%
jan 1, 2003
27.618 mln
+22.316 mln
420.85%
jan 1, 2004
81.738 mln
+54.12 mln
195.96%
jan 1, 2005
46.064 mln
-35.674 mln
-43.64%
jan 1, 2006
21.212 mln
-24.852 mln
-53.95%
jan 1, 2007
50.675 mln
+29.463 mln
138.9%
jan 1, 2008
729.044 mln
+678.369 mln
1.34K%
jan 1, 2009
95.586 mln
-633.458 mln
-86.89%
jan 1, 2010
116.258 mln
+20.672 mln
21.63%
jan 1, 2011
178.065 mln
+61.807 mln
53.16%
jan 1, 2012
139.862 mln
-38.203 mln
-21.45%
jan 1, 2013
163.41 mln
+23.548 mln
16.84%
jan 1, 2014
371.847 mln
+208.436 mln
127.55%
jan 1, 2015
944.327 mln
+572.481 mln
153.96%
jan 1, 2016
1.437 bln
+492.673 mln
52.17%
Ranking of countries by current statistics by years


Comments: