29
/
en
AIzaSyAYiBZKx7MnpbEhh9jyipgxe19OcubqV5w
April 1, 2024
216407
Pakistan
PAK
true
2
1
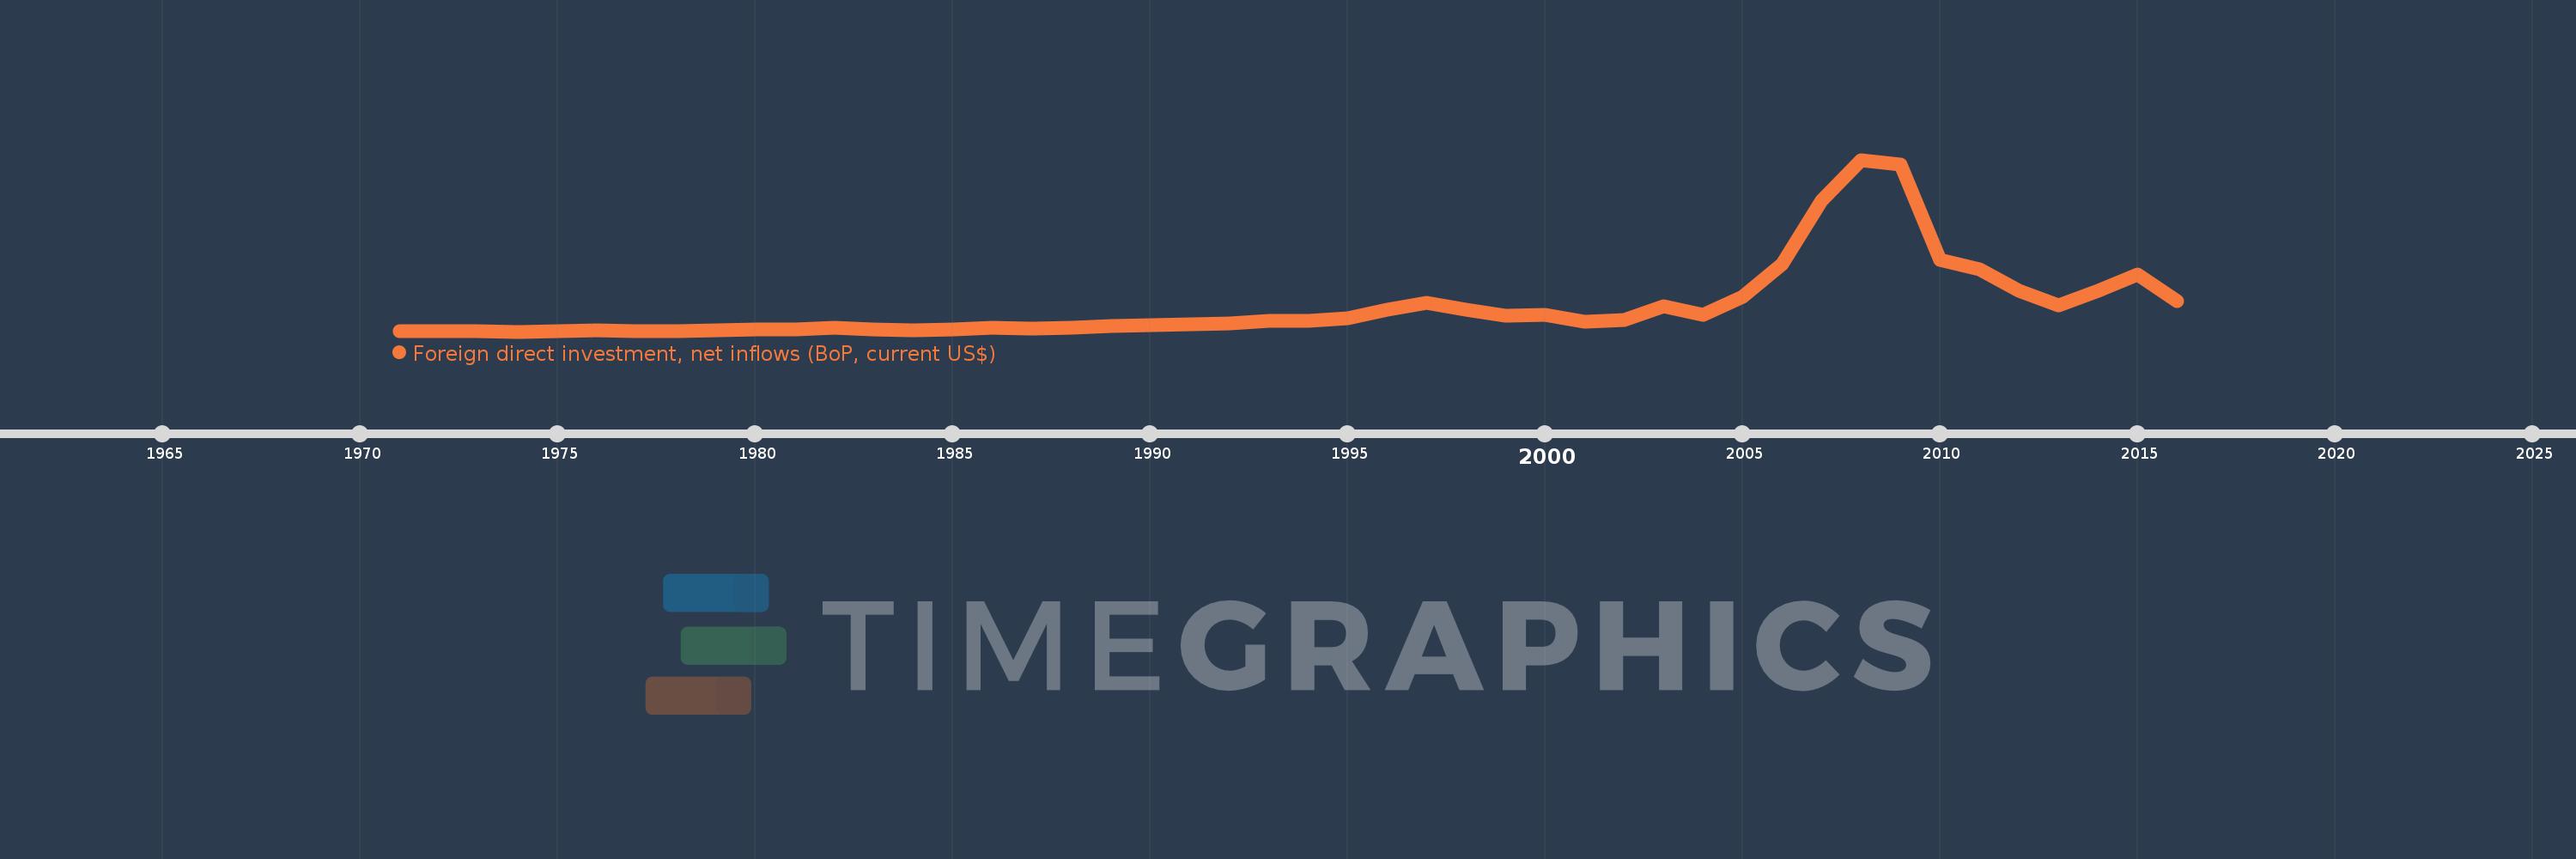
Foreign direct investment, net inflows (BoP, current US$)
2016,2015,2014,2013,2012,2011,2010,2009,2008,2007,2006,2005,2004,2003,2002,2001,2000,1999,1998,1997,1996,1995,1994,1993,1992,1991,1990,1989,1988,1987,1986,1985,1984,1983,1982,1981,1980,1979,1978,1977,1976,1975,1974,1973,1972,1971
This statistics in other country:
AfghanistanAlbaniaAlgeriaAngolaAntigua and BarbudaArab WorldArgentinaArmeniaArubaAustraliaAustriaAzerbaijanBahamas, TheBahrainBangladeshBarbadosBelarusBelgiumBelizeBeninBermudaBhutanBoliviaBosnia and HerzegovinaBotswanaBrazilBritish Virgin IslandsBrunei DarussalamBulgariaBurkina FasoBurundiCabo VerdeCambodiaCameroonCanadaCaribbean small statesCayman IslandsCentral African RepublicCentral Europe and the BalticsChadChileChinaColombiaComorosCongo, Dem. Rep.Congo, Rep.Costa RicaCote d'IvoireCroatiaCuracaoCyprusCzech RepublicDenmarkDjiboutiDominicaDominican RepublicEarly-demographic dividendEast Asia & PacificEast Asia & Pacific (excluding high income)East Asia & Pacific (IDA & IBRD countries)EcuadorEgypt, Arab Rep.El SalvadorEquatorial GuineaEritreaEstoniaEthiopiaEuro areaEurope & Central AsiaEurope & Central Asia (excluding high income)Europe & Central Asia (IDA & IBRD countries)European UnionFijiFinlandFragile and conflict affected situationsFranceFrench PolynesiaGabonGambia, TheGeorgiaGermanyGhanaGibraltarGreeceGrenadaGuatemalaGuineaGuinea-BissauGuyanaHaitiHeavily indebted poor countries (HIPC)High incomeHondurasHong Kong SAR, ChinaHungaryIBRD onlyIcelandIDA & IBRD totalIDA blendIDA onlyIDA totalIndiaIndonesiaIran, Islamic Rep.IraqIrelandIsraelItalyJamaicaJapanJordanKazakhstanKenyaKiribatiKorea, Dem. People’s Rep.Korea, Rep.KosovoKuwaitKyrgyz RepublicLao PDRLate-demographic dividendLatin America & Caribbean Latin America & Caribbean (excluding high income)Latin America & the Caribbean (IDA & IBRD countries)LatviaLeast developed countries: UN classificationLebanonLesothoLiberiaLibyaLithuaniaLow & middle incomeLow incomeLower middle incomeLuxembourgMacao SAR, ChinaMacedonia, FYRMadagascarMalawiMalaysiaMaldivesMaliMaltaMarshall IslandsMauritaniaMauritiusMexicoMicronesia, Fed. Sts.Middle East & North AfricaMiddle East & North Africa (excluding high income)Middle East & North Africa (IDA & IBRD countries)Middle incomeMoldovaMongoliaMontenegroMoroccoMozambiqueMyanmarNamibiaNauruNepalNetherlandsNew CaledoniaNew ZealandNicaraguaNigerNigeriaNorth AmericaNorthern Mariana IslandsNorwayOECD membersOmanOther small statesPacific island small statesPakistanPalauPanamaPapua New GuineaParaguayPeruPhilippinesPolandPortugalPost-demographic dividendPre-demographic dividendQatarRomaniaRussian FederationRwandaSamoaSao Tome and PrincipeSaudi ArabiaSenegalSerbiaSeychellesSierra LeoneSingaporeSint Maarten (Dutch part)Slovak RepublicSloveniaSmall statesSolomon IslandsSomaliaSouth AfricaSouth AsiaSouth Asia (IDA & IBRD)South SudanSpainSri LankaSt. Kitts and NevisSt. LuciaSt. Vincent and the GrenadinesSub-Saharan Africa Sub-Saharan Africa (excluding high income)Sub-Saharan Africa (IDA & IBRD countries)SudanSurinameSwazilandSwedenSwitzerlandSyrian Arab RepublicTajikistanTanzaniaThailandTimor-LesteTogoTongaTrinidad and TobagoTunisiaTurkeyTurkmenistanTuvaluUgandaUkraineUnited Arab EmiratesUnited KingdomUnited StatesUpper middle incomeUruguayUzbekistanVanuatuVenezuela, RBVietnamWest Bank and GazaWorldYemen, Rep.ZambiaZimbabwe Timeline:
This timeline shows a graph from 1971 to 2016 of Pakistan. No data until 1970. Number of actual observations by date: 46.
Source name:
World Development Indicators
Source organization:
International Monetary Fund, Balance of Payments database, supplemented by data from the United Nations Conference on Trade and Development and official national sources.
Categories, topics:
Economy & Growth, Financial Sector, External Debt
Last updated:
apr 23, 2017
Indicators value changes by year
Minimum:
-4.0 mln
jan 1, 1974
Maximum:
5.59 bln
jan 1, 2008
At the date of observation
Value
Absolute change
Change from previous value
jan 1, 1971
23.0 mln
+23.0 mln
0.0%
jan 1, 1972
1000.0K
-22.0 mln
-95.65%
jan 1, 1973
17.0 mln
+16.0 mln
1.6K%
jan 1, 1974
-4.0 mln
-21.0 mln
-123.53%
jan 1, 1975
4.0 mln
+8.0 mln
-200.0%
jan 1, 1976
25.0 mln
+21.0 mln
525.0%
jan 1, 1977
8.221 mln
-16.779 mln
-67.12%
jan 1, 1978
15.223 mln
+7.003 mln
85.19%
jan 1, 1979
32.273 mln
+17.05 mln
112.0%
jan 1, 1980
58.254 mln
+25.981 mln
80.5%
jan 1, 1981
63.633 mln
+5.379 mln
9.23%
jan 1, 1982
108.085 mln
+44.452 mln
69.86%
jan 1, 1983
63.833 mln
-44.252 mln
-40.94%
jan 1, 1984
29.457 mln
-34.376 mln
-53.85%
jan 1, 1985
55.51 mln
+26.053 mln
88.44%
jan 1, 1986
131.389 mln
+75.879 mln
136.69%
jan 1, 1987
105.73 mln
-25.659 mln
-19.53%
jan 1, 1988
129.378 mln
+23.647 mln
22.37%
jan 1, 1989
186.492 mln
+57.114 mln
44.15%
jan 1, 1990
210.6 mln
+24.108 mln
12.93%
jan 1, 1991
245.263 mln
+34.663 mln
16.46%
jan 1, 1992
258.414 mln
+13.152 mln
5.36%
jan 1, 1993
336.48 mln
+78.065 mln
30.21%
jan 1, 1994
348.557 mln
+12.077 mln
3.59%
jan 1, 1995
421.025 mln
+72.468 mln
20.79%
jan 1, 1996
722.632 mln
+301.607 mln
71.64%
jan 1, 1997
921.976 mln
+199.345 mln
27.59%
jan 1, 1998
716.253 mln
-205.723 mln
-22.31%
jan 1, 1999
506.0 mln
-210.253 mln
-29.35%
jan 1, 2000
532.0 mln
+26.0 mln
5.14%
jan 1, 2001
308.0 mln
-224.0 mln
-42.11%
jan 1, 2002
378.0 mln
+70.0 mln
22.73%
jan 1, 2003
826.0 mln
+448.0 mln
118.52%
jan 1, 2004
534.0 mln
-292.0 mln
-35.35%
jan 1, 2005
1.118 bln
+584.0 mln
109.36%
jan 1, 2006
2.201 bln
+1.083 bln
96.87%
jan 1, 2007
4.273 bln
+2.072 bln
94.14%
jan 1, 2008
5.59 bln
+1.317 bln
30.82%
jan 1, 2009
5.438 bln
-152.0 mln
-2.72%
jan 1, 2010
2.338 bln
-3.1 bln
-57.01%
jan 1, 2011
2.022 bln
-316.0 mln
-13.52%
jan 1, 2012
1.326 bln
-696.0 mln
-34.42%
jan 1, 2013
859.0 mln
-467.0 mln
-35.22%
jan 1, 2014
1.333 bln
+474.0 mln
55.18%
jan 1, 2015
1.867 bln
+534.0 mln
40.06%
jan 1, 2016
979.0 mln
-888.0 mln
-47.56%
Ranking of countries by current statistics by years


Comments: