29
/
en
AIzaSyAYiBZKx7MnpbEhh9jyipgxe19OcubqV5w
April 1, 2024
169891
Korea, Rep.
KOR
true
2
1
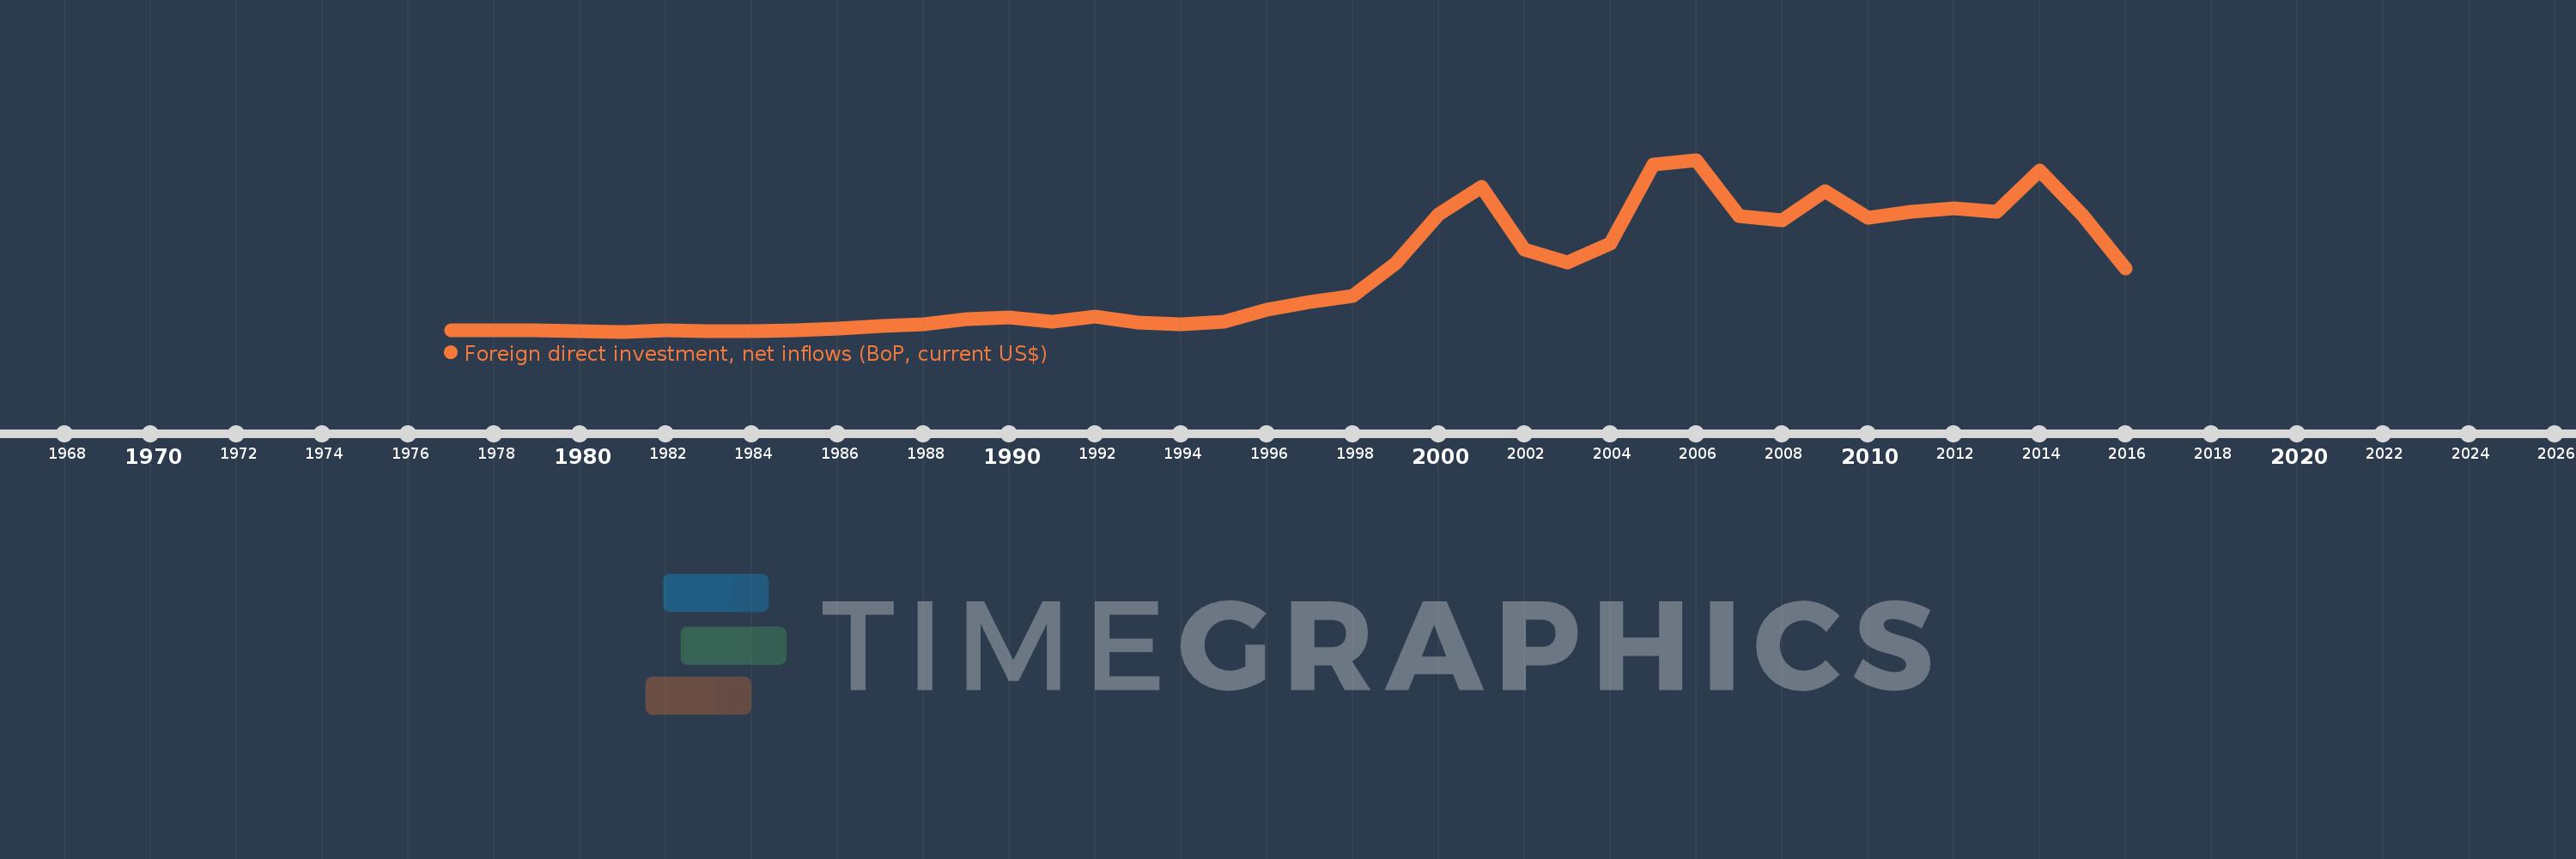
Foreign direct investment, net inflows (BoP, current US$)
2016,2015,2014,2013,2012,2011,2010,2009,2008,2007,2006,2005,2004,2003,2002,2001,2000,1999,1998,1997,1996,1995,1994,1993,1992,1991,1990,1989,1988,1987,1986,1985,1984,1983,1982,1981,1980,1979,1978,1977
This statistics in other country:
AfghanistanAlbaniaAlgeriaAngolaAntigua and BarbudaArab WorldArgentinaArmeniaArubaAustraliaAustriaAzerbaijanBahamas, TheBahrainBangladeshBarbadosBelarusBelgiumBelizeBeninBermudaBhutanBoliviaBosnia and HerzegovinaBotswanaBrazilBritish Virgin IslandsBrunei DarussalamBulgariaBurkina FasoBurundiCabo VerdeCambodiaCameroonCanadaCaribbean small statesCayman IslandsCentral African RepublicCentral Europe and the BalticsChadChileChinaColombiaComorosCongo, Dem. Rep.Congo, Rep.Costa RicaCote d'IvoireCroatiaCuracaoCyprusCzech RepublicDenmarkDjiboutiDominicaDominican RepublicEarly-demographic dividendEast Asia & PacificEast Asia & Pacific (excluding high income)East Asia & Pacific (IDA & IBRD countries)EcuadorEgypt, Arab Rep.El SalvadorEquatorial GuineaEritreaEstoniaEthiopiaEuro areaEurope & Central AsiaEurope & Central Asia (excluding high income)Europe & Central Asia (IDA & IBRD countries)European UnionFijiFinlandFragile and conflict affected situationsFranceFrench PolynesiaGabonGambia, TheGeorgiaGermanyGhanaGibraltarGreeceGrenadaGuatemalaGuineaGuinea-BissauGuyanaHaitiHeavily indebted poor countries (HIPC)High incomeHondurasHong Kong SAR, ChinaHungaryIBRD onlyIcelandIDA & IBRD totalIDA blendIDA onlyIDA totalIndiaIndonesiaIran, Islamic Rep.IraqIrelandIsraelItalyJamaicaJapanJordanKazakhstanKenyaKiribatiKorea, Dem. People’s Rep.Korea, Rep.KosovoKuwaitKyrgyz RepublicLao PDRLate-demographic dividendLatin America & Caribbean Latin America & Caribbean (excluding high income)Latin America & the Caribbean (IDA & IBRD countries)LatviaLeast developed countries: UN classificationLebanonLesothoLiberiaLibyaLithuaniaLow & middle incomeLow incomeLower middle incomeLuxembourgMacao SAR, ChinaMacedonia, FYRMadagascarMalawiMalaysiaMaldivesMaliMaltaMarshall IslandsMauritaniaMauritiusMexicoMicronesia, Fed. Sts.Middle East & North AfricaMiddle East & North Africa (excluding high income)Middle East & North Africa (IDA & IBRD countries)Middle incomeMoldovaMongoliaMontenegroMoroccoMozambiqueMyanmarNamibiaNauruNepalNetherlandsNew CaledoniaNew ZealandNicaraguaNigerNigeriaNorth AmericaNorthern Mariana IslandsNorwayOECD membersOmanOther small statesPacific island small statesPakistanPalauPanamaPapua New GuineaParaguayPeruPhilippinesPolandPortugalPost-demographic dividendPre-demographic dividendQatarRomaniaRussian FederationRwandaSamoaSao Tome and PrincipeSaudi ArabiaSenegalSerbiaSeychellesSierra LeoneSingaporeSint Maarten (Dutch part)Slovak RepublicSloveniaSmall statesSolomon IslandsSomaliaSouth AfricaSouth AsiaSouth Asia (IDA & IBRD)South SudanSpainSri LankaSt. Kitts and NevisSt. LuciaSt. Vincent and the GrenadinesSub-Saharan Africa Sub-Saharan Africa (excluding high income)Sub-Saharan Africa (IDA & IBRD countries)SudanSurinameSwazilandSwedenSwitzerlandSyrian Arab RepublicTajikistanTanzaniaThailandTimor-LesteTogoTongaTrinidad and TobagoTunisiaTurkeyTurkmenistanTuvaluUgandaUkraineUnited Arab EmiratesUnited KingdomUnited StatesUpper middle incomeUruguayUzbekistanVanuatuVenezuela, RBVietnamWest Bank and GazaWorldYemen, Rep.ZambiaZimbabwe Timeline:
This timeline shows a graph from 1977 to 2016 of Korea, Rep.. No data until 1976. Number of actual observations by date: 40.
Source name:
World Development Indicators
Source organization:
International Monetary Fund, Balance of Payments database, supplemented by data from the United Nations Conference on Trade and Development and official national sources.
Categories, topics:
Economy & Growth, Financial Sector, External Debt
Last updated:
apr 23, 2017
Indicators value changes by year
Minimum:
6.0 mln
jan 1, 1981
Maximum:
13.643 bln
jan 1, 2006
At the date of observation
Value
Absolute change
Change from previous value
jan 1, 1977
81.0 mln
+81.0 mln
0.0%
jan 1, 1978
94.0 mln
+13.0 mln
16.05%
jan 1, 1979
89.0 mln
-5.0 mln
-5.32%
jan 1, 1980
35.0 mln
-54.0 mln
-60.67%
jan 1, 1981
6.0 mln
-29.0 mln
-82.86%
jan 1, 1982
102.0 mln
+96.0 mln
1.6K%
jan 1, 1983
69.0 mln
-33.0 mln
-32.35%
jan 1, 1984
68.5 mln
-500.0K
-0.72%
jan 1, 1985
110.2 mln
+41.7 mln
60.88%
jan 1, 1986
233.5 mln
+123.3 mln
111.89%
jan 1, 1987
459.6 mln
+226.1 mln
96.83%
jan 1, 1988
616.3 mln
+156.7 mln
34.09%
jan 1, 1989
1.014 bln
+397.8 mln
64.55%
jan 1, 1990
1.118 bln
+103.7 mln
10.23%
jan 1, 1991
788.5 mln
-329.3 mln
-29.46%
jan 1, 1992
1.18 bln
+391.3 mln
49.63%
jan 1, 1993
728.3 mln
-451.5 mln
-38.27%
jan 1, 1994
588.1 mln
-140.2 mln
-19.25%
jan 1, 1995
809.0 mln
+220.9 mln
37.56%
jan 1, 1996
1.776 bln
+966.8 mln
119.51%
jan 1, 1997
2.325 bln
+549.6 mln
30.95%
jan 1, 1998
2.844 bln
+518.8 mln
22.31%
jan 1, 1999
5.412 bln
+2.568 bln
90.29%
jan 1, 2000
9.333 bln
+3.921 bln
72.45%
jan 1, 2001
11.509 bln
+2.176 bln
23.31%
jan 1, 2002
6.522 bln
-4.987 bln
-43.33%
jan 1, 2003
5.475 bln
-1.047 bln
-16.06%
jan 1, 2004
7.01 bln
+1.535 bln
28.03%
jan 1, 2005
13.294 bln
+6.284 bln
89.65%
jan 1, 2006
13.643 bln
+348.8 mln
2.62%
jan 1, 2007
9.162 bln
-4.481 bln
-32.85%
jan 1, 2008
8.827 bln
-335.0 mln
-3.66%
jan 1, 2009
11.188 bln
+2.361 bln
26.74%
jan 1, 2010
9.022 bln
-2.166 bln
-19.36%
jan 1, 2011
9.497 bln
+475.5 mln
5.27%
jan 1, 2012
9.773 bln
+275.6 mln
2.9%
jan 1, 2013
9.496 bln
-277.1 mln
-2.84%
jan 1, 2014
12.767 bln
+3.271 bln
34.44%
jan 1, 2015
9.274 bln
-3.493 bln
-27.36%
jan 1, 2016
5.042 bln
-4.232 bln
-45.63%
Ranking of countries by current statistics by years


Comments: