29
/
en
AIzaSyAYiBZKx7MnpbEhh9jyipgxe19OcubqV5w
April 1, 2024
287190
Zimbabwe
ZWE
true
2
1
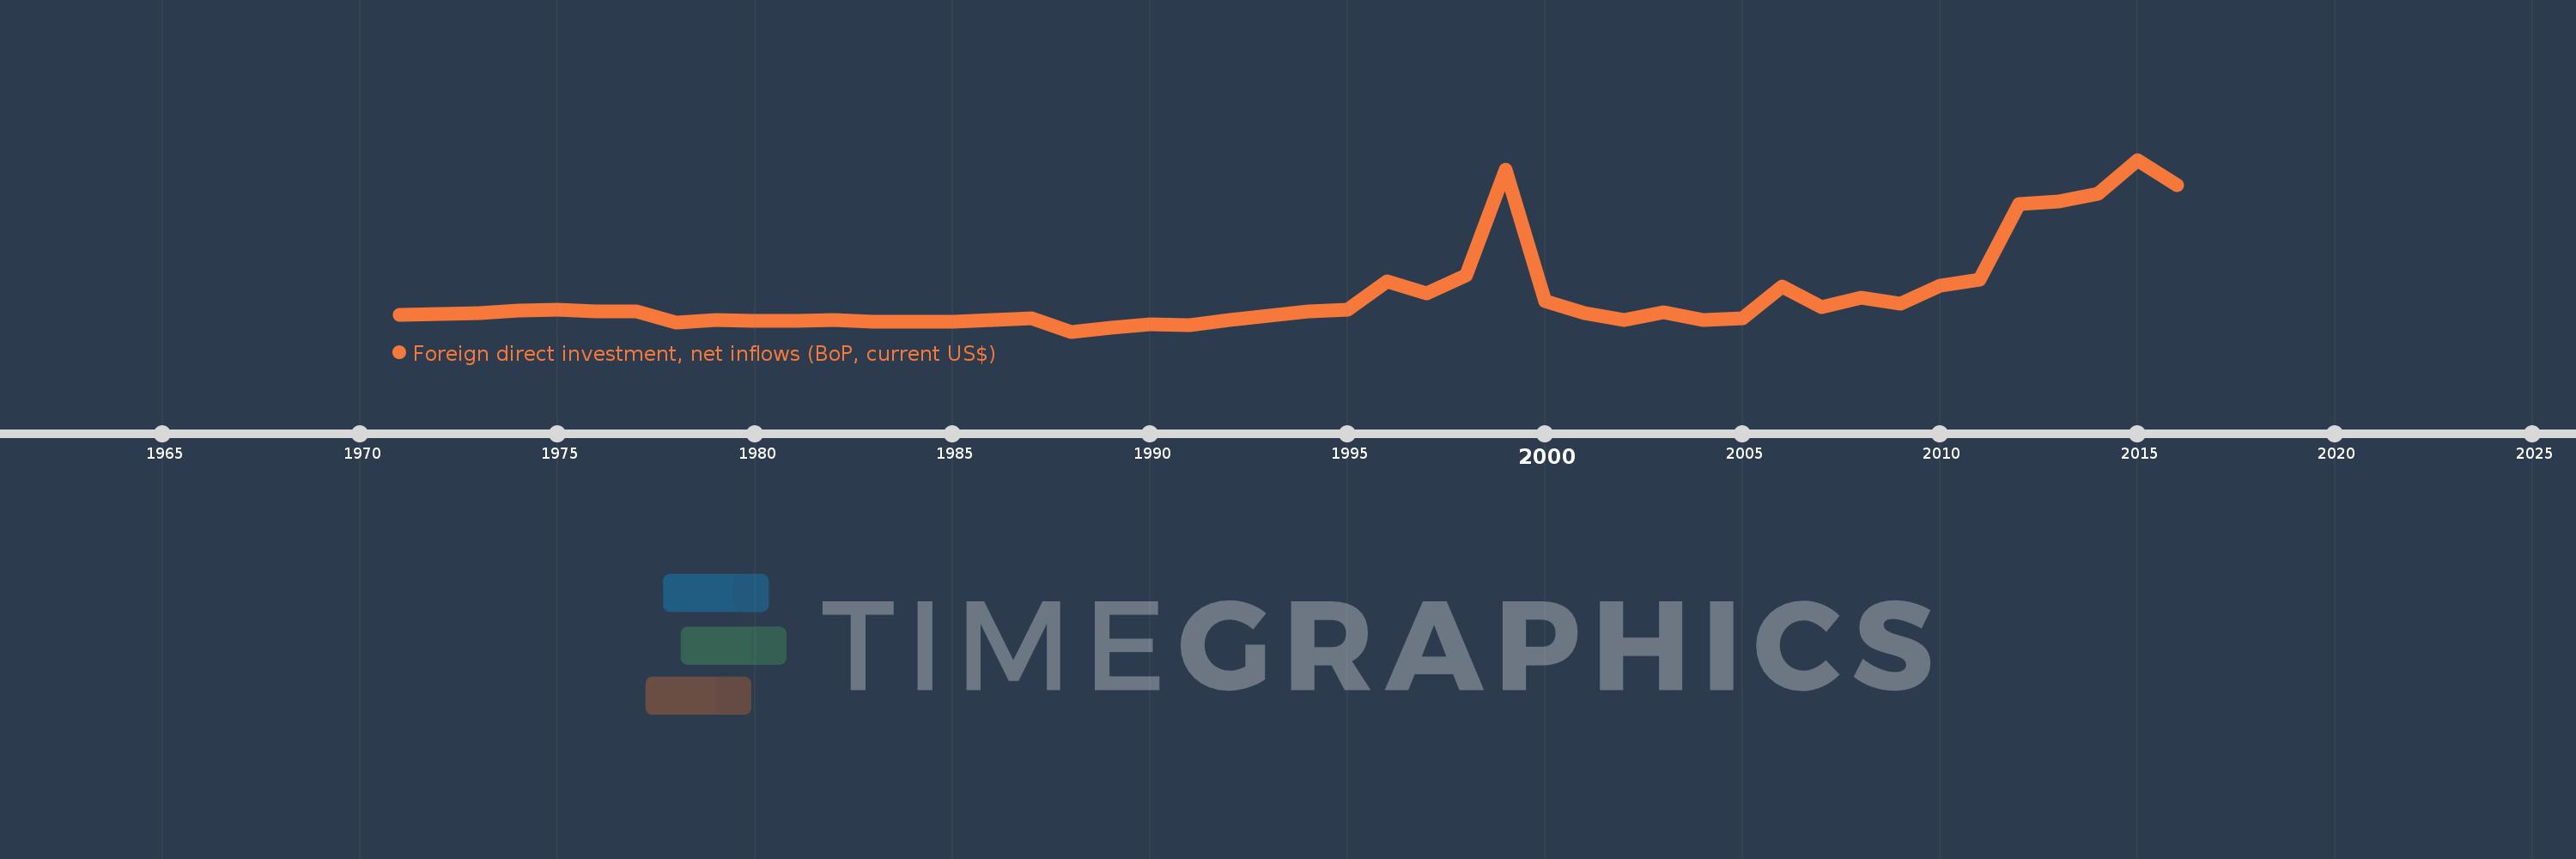
Foreign direct investment, net inflows (BoP, current US$)
2016,2015,2014,2013,2012,2011,2010,2009,2008,2007,2006,2005,2004,2003,2002,2001,2000,1999,1998,1997,1996,1995,1994,1993,1992,1991,1990,1989,1988,1987,1986,1985,1984,1983,1982,1981,1980,1979,1978,1977,1976,1975,1974,1973,1972,1971
This statistics in other country:
AfghanistanAlbaniaAlgeriaAngolaAntigua and BarbudaArab WorldArgentinaArmeniaArubaAustraliaAustriaAzerbaijanBahamas, TheBahrainBangladeshBarbadosBelarusBelgiumBelizeBeninBermudaBhutanBoliviaBosnia and HerzegovinaBotswanaBrazilBritish Virgin IslandsBrunei DarussalamBulgariaBurkina FasoBurundiCabo VerdeCambodiaCameroonCanadaCaribbean small statesCayman IslandsCentral African RepublicCentral Europe and the BalticsChadChileChinaColombiaComorosCongo, Dem. Rep.Congo, Rep.Costa RicaCote d'IvoireCroatiaCuracaoCyprusCzech RepublicDenmarkDjiboutiDominicaDominican RepublicEarly-demographic dividendEast Asia & PacificEast Asia & Pacific (excluding high income)East Asia & Pacific (IDA & IBRD countries)EcuadorEgypt, Arab Rep.El SalvadorEquatorial GuineaEritreaEstoniaEthiopiaEuro areaEurope & Central AsiaEurope & Central Asia (excluding high income)Europe & Central Asia (IDA & IBRD countries)European UnionFijiFinlandFragile and conflict affected situationsFranceFrench PolynesiaGabonGambia, TheGeorgiaGermanyGhanaGibraltarGreeceGrenadaGuatemalaGuineaGuinea-BissauGuyanaHaitiHeavily indebted poor countries (HIPC)High incomeHondurasHong Kong SAR, ChinaHungaryIBRD onlyIcelandIDA & IBRD totalIDA blendIDA onlyIDA totalIndiaIndonesiaIran, Islamic Rep.IraqIrelandIsraelItalyJamaicaJapanJordanKazakhstanKenyaKiribatiKorea, Dem. People’s Rep.Korea, Rep.KosovoKuwaitKyrgyz RepublicLao PDRLate-demographic dividendLatin America & Caribbean Latin America & Caribbean (excluding high income)Latin America & the Caribbean (IDA & IBRD countries)LatviaLeast developed countries: UN classificationLebanonLesothoLiberiaLibyaLithuaniaLow & middle incomeLow incomeLower middle incomeLuxembourgMacao SAR, ChinaMacedonia, FYRMadagascarMalawiMalaysiaMaldivesMaliMaltaMarshall IslandsMauritaniaMauritiusMexicoMicronesia, Fed. Sts.Middle East & North AfricaMiddle East & North Africa (excluding high income)Middle East & North Africa (IDA & IBRD countries)Middle incomeMoldovaMongoliaMontenegroMoroccoMozambiqueMyanmarNamibiaNauruNepalNetherlandsNew CaledoniaNew ZealandNicaraguaNigerNigeriaNorth AmericaNorthern Mariana IslandsNorwayOECD membersOmanOther small statesPacific island small statesPakistanPalauPanamaPapua New GuineaParaguayPeruPhilippinesPolandPortugalPost-demographic dividendPre-demographic dividendQatarRomaniaRussian FederationRwandaSamoaSao Tome and PrincipeSaudi ArabiaSenegalSerbiaSeychellesSierra LeoneSingaporeSint Maarten (Dutch part)Slovak RepublicSloveniaSmall statesSolomon IslandsSomaliaSouth AfricaSouth AsiaSouth Asia (IDA & IBRD)South SudanSpainSri LankaSt. Kitts and NevisSt. LuciaSt. Vincent and the GrenadinesSub-Saharan Africa Sub-Saharan Africa (excluding high income)Sub-Saharan Africa (IDA & IBRD countries)SudanSurinameSwazilandSwedenSwitzerlandSyrian Arab RepublicTajikistanTanzaniaThailandTimor-LesteTogoTongaTrinidad and TobagoTunisiaTurkeyTurkmenistanTuvaluUgandaUkraineUnited Arab EmiratesUnited KingdomUnited StatesUpper middle incomeUruguayUzbekistanVanuatuVenezuela, RBVietnamWest Bank and GazaWorldYemen, Rep.ZambiaZimbabwe Timeline:
This timeline shows a graph from 1971 to 2016 of Zimbabwe. No data until 1970. Number of actual observations by date: 46.
Source name:
World Development Indicators
Source organization:
International Monetary Fund, Balance of Payments database, supplemented by data from the United Nations Conference on Trade and Development and official national sources.
Categories, topics:
Economy & Growth, Financial Sector, External Debt
Last updated:
apr 23, 2017
Indicators value changes by year
Minimum:
-30.507 mln
jan 1, 1988
Maximum:
472.8 mln
jan 1, 2015
At the date of observation
Value
Absolute change
Change from previous value
jan 1, 1971
18.67 mln
+18.67 mln
0.0%
jan 1, 1972
21.84 mln
+3.17 mln
16.98%
jan 1, 1973
23.49 mln
+1.65 mln
7.55%
jan 1, 1974
30.49 mln
+7.0 mln
29.8%
jan 1, 1975
33.35 mln
+2.86 mln
9.38%
jan 1, 1976
28.87 mln
-4.48 mln
-13.43%
jan 1, 1977
29.09 mln
+220.0K
0.76%
jan 1, 1978
-3.815 mln
-32.905 mln
-113.12%
jan 1, 1979
2.519 mln
+6.334 mln
-166.03%
jan 1, 1980
146.951K
-2.372 mln
-94.17%
jan 1, 1981
1.55 mln
+1.403 mln
954.56%
jan 1, 1982
3.546 mln
+1.996 mln
128.82%
jan 1, 1983
-841.285K
-4.387 mln
-123.72%
jan 1, 1984
-2.074 mln
-1.233 mln
146.57%
jan 1, 1985
-2.488 mln
-413.875K
19.95%
jan 1, 1986
2.849 mln
+5.337 mln
-214.48%
jan 1, 1987
7.445 mln
+4.597 mln
161.36%
jan 1, 1988
-30.507 mln
-37.952 mln
-509.75%
jan 1, 1989
-18.034 mln
+12.473 mln
-40.89%
jan 1, 1990
-10.181 mln
+7.853 mln
-43.55%
jan 1, 1991
-12.206 mln
-2.025 mln
19.89%
jan 1, 1992
2.79 mln
+14.996 mln
-122.86%
jan 1, 1993
14.95 mln
+12.159 mln
435.75%
jan 1, 1994
27.955 mln
+13.005 mln
86.99%
jan 1, 1995
34.649 mln
+6.694 mln
23.94%
jan 1, 1996
117.7 mln
+83.051 mln
239.69%
jan 1, 1997
80.9 mln
-36.8 mln
-31.27%
jan 1, 1998
135.1 mln
+54.2 mln
67.0%
jan 1, 1999
444.3 mln
+309.2 mln
228.87%
jan 1, 2000
59.0 mln
-385.3 mln
-86.72%
jan 1, 2001
23.2 mln
-35.8 mln
-60.68%
jan 1, 2002
3.8 mln
-19.4 mln
-83.62%
jan 1, 2003
25.9 mln
+22.1 mln
581.58%
jan 1, 2004
3.8 mln
-22.1 mln
-85.33%
jan 1, 2005
8.7 mln
+4.9 mln
128.95%
jan 1, 2006
102.8 mln
+94.1 mln
1.08K%
jan 1, 2007
40.0 mln
-62.8 mln
-61.09%
jan 1, 2008
68.9 mln
+28.9 mln
72.25%
jan 1, 2009
51.6 mln
-17.3 mln
-25.11%
jan 1, 2010
105.0 mln
+53.4 mln
103.49%
jan 1, 2011
122.587 mln
+17.587 mln
16.75%
jan 1, 2012
344.3 mln
+221.713 mln
180.86%
jan 1, 2013
349.85 mln
+5.55 mln
1.61%
jan 1, 2014
373.05 mln
+23.2 mln
6.63%
jan 1, 2015
472.8 mln
+99.75 mln
26.74%
jan 1, 2016
399.2 mln
-73.6 mln
-15.57%
Ranking of countries by current statistics by years


Comments: