29
/
en
AIzaSyAYiBZKx7MnpbEhh9jyipgxe19OcubqV5w
April 1, 2024
214292
Norway
NOR
true
2
1
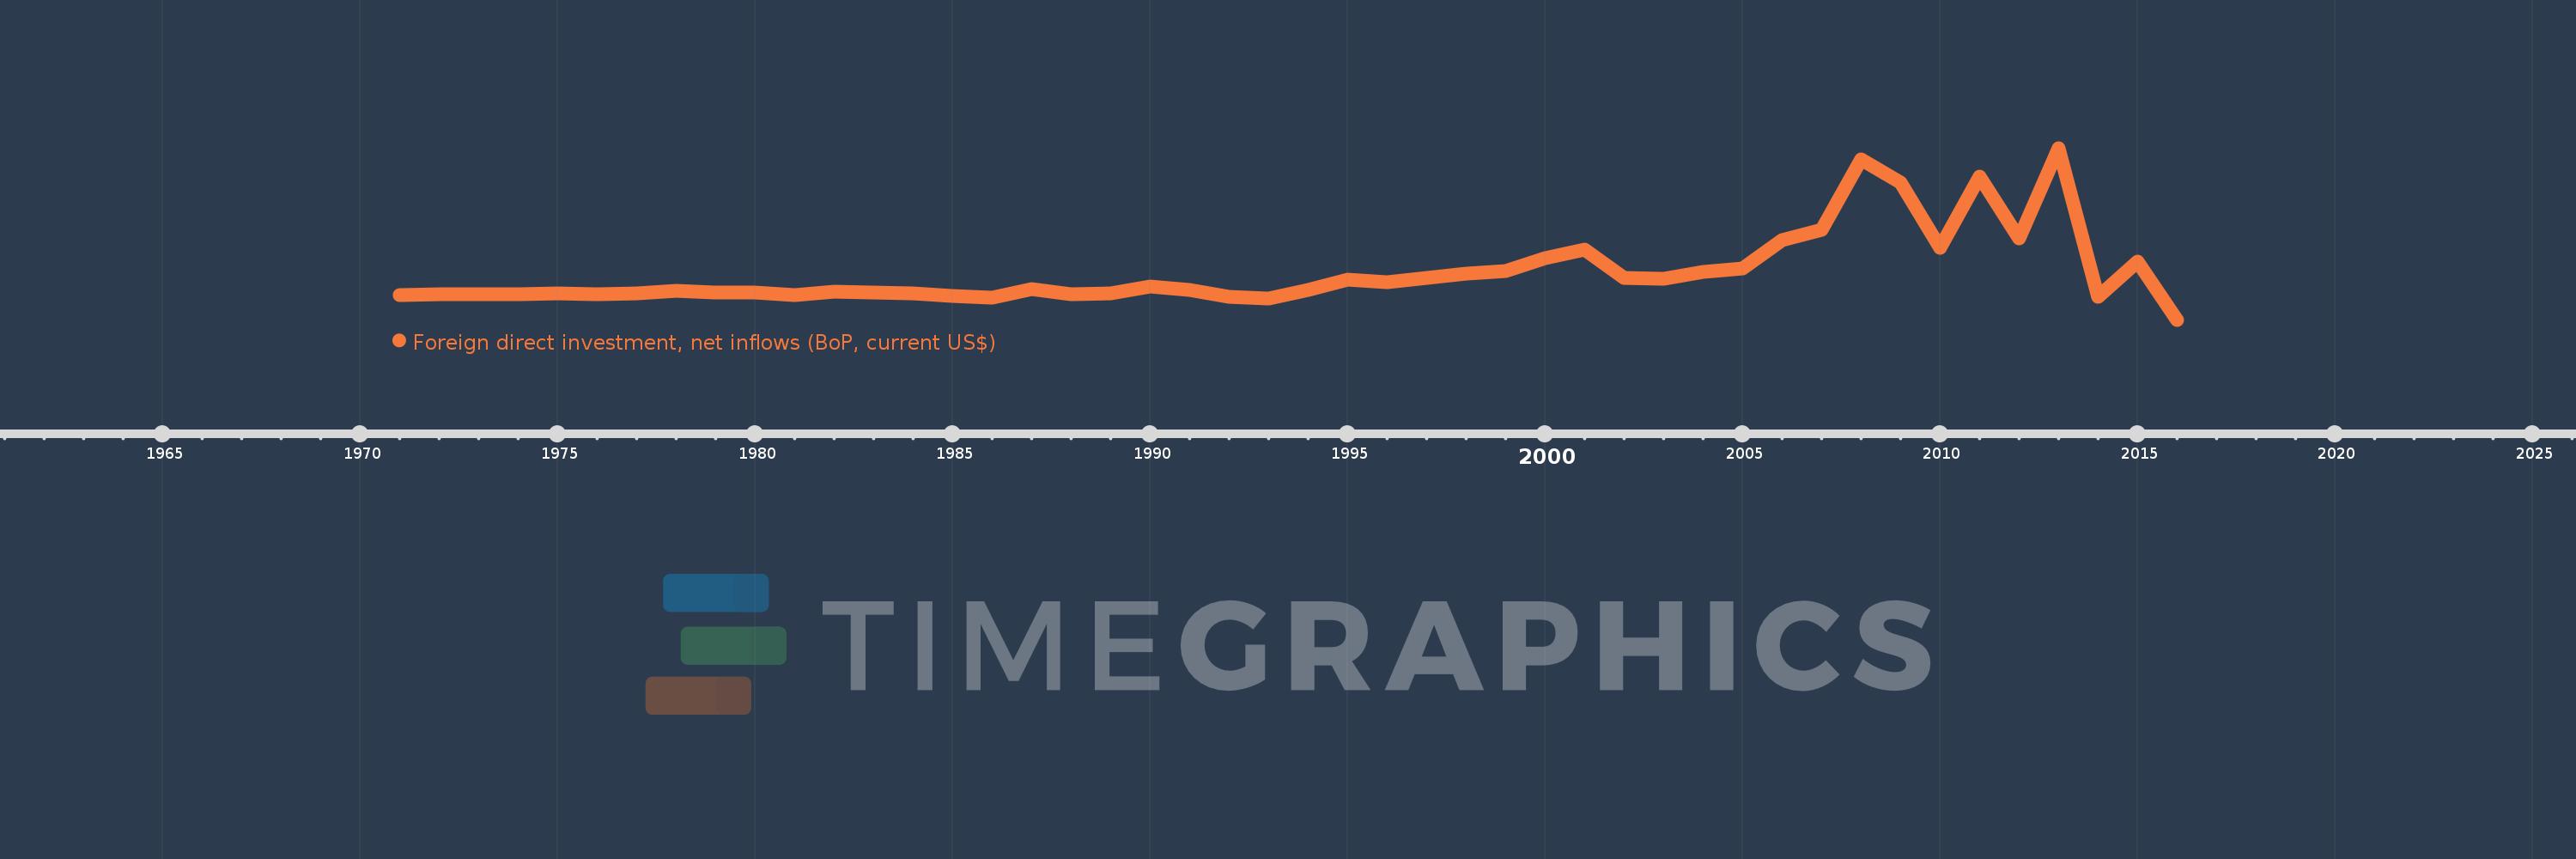
Foreign direct investment, net inflows (BoP, current US$)
2016,2015,2014,2013,2012,2011,2010,2009,2008,2007,2006,2005,2004,2003,2002,2001,2000,1999,1998,1997,1996,1995,1994,1993,1992,1991,1990,1989,1988,1987,1986,1985,1984,1983,1982,1981,1980,1979,1978,1977,1976,1975,1974,1973,1972,1971
This statistics in other country:
AfghanistanAlbaniaAlgeriaAngolaAntigua and BarbudaArab WorldArgentinaArmeniaArubaAustraliaAustriaAzerbaijanBahamas, TheBahrainBangladeshBarbadosBelarusBelgiumBelizeBeninBermudaBhutanBoliviaBosnia and HerzegovinaBotswanaBrazilBritish Virgin IslandsBrunei DarussalamBulgariaBurkina FasoBurundiCabo VerdeCambodiaCameroonCanadaCaribbean small statesCayman IslandsCentral African RepublicCentral Europe and the BalticsChadChileChinaColombiaComorosCongo, Dem. Rep.Congo, Rep.Costa RicaCote d'IvoireCroatiaCuracaoCyprusCzech RepublicDenmarkDjiboutiDominicaDominican RepublicEarly-demographic dividendEast Asia & PacificEast Asia & Pacific (excluding high income)East Asia & Pacific (IDA & IBRD countries)EcuadorEgypt, Arab Rep.El SalvadorEquatorial GuineaEritreaEstoniaEthiopiaEuro areaEurope & Central AsiaEurope & Central Asia (excluding high income)Europe & Central Asia (IDA & IBRD countries)European UnionFijiFinlandFragile and conflict affected situationsFranceFrench PolynesiaGabonGambia, TheGeorgiaGermanyGhanaGibraltarGreeceGrenadaGuatemalaGuineaGuinea-BissauGuyanaHaitiHeavily indebted poor countries (HIPC)High incomeHondurasHong Kong SAR, ChinaHungaryIBRD onlyIcelandIDA & IBRD totalIDA blendIDA onlyIDA totalIndiaIndonesiaIran, Islamic Rep.IraqIrelandIsraelItalyJamaicaJapanJordanKazakhstanKenyaKiribatiKorea, Dem. People’s Rep.Korea, Rep.KosovoKuwaitKyrgyz RepublicLao PDRLate-demographic dividendLatin America & Caribbean Latin America & Caribbean (excluding high income)Latin America & the Caribbean (IDA & IBRD countries)LatviaLeast developed countries: UN classificationLebanonLesothoLiberiaLibyaLithuaniaLow & middle incomeLow incomeLower middle incomeLuxembourgMacao SAR, ChinaMacedonia, FYRMadagascarMalawiMalaysiaMaldivesMaliMaltaMarshall IslandsMauritaniaMauritiusMexicoMicronesia, Fed. Sts.Middle East & North AfricaMiddle East & North Africa (excluding high income)Middle East & North Africa (IDA & IBRD countries)Middle incomeMoldovaMongoliaMontenegroMoroccoMozambiqueMyanmarNamibiaNauruNepalNetherlandsNew CaledoniaNew ZealandNicaraguaNigerNigeriaNorth AmericaNorthern Mariana IslandsNorwayOECD membersOmanOther small statesPacific island small statesPakistanPalauPanamaPapua New GuineaParaguayPeruPhilippinesPolandPortugalPost-demographic dividendPre-demographic dividendQatarRomaniaRussian FederationRwandaSamoaSao Tome and PrincipeSaudi ArabiaSenegalSerbiaSeychellesSierra LeoneSingaporeSint Maarten (Dutch part)Slovak RepublicSloveniaSmall statesSolomon IslandsSomaliaSouth AfricaSouth AsiaSouth Asia (IDA & IBRD)South SudanSpainSri LankaSt. Kitts and NevisSt. LuciaSt. Vincent and the GrenadinesSub-Saharan Africa Sub-Saharan Africa (excluding high income)Sub-Saharan Africa (IDA & IBRD countries)SudanSurinameSwazilandSwedenSwitzerlandSyrian Arab RepublicTajikistanTanzaniaThailandTimor-LesteTogoTongaTrinidad and TobagoTunisiaTurkeyTurkmenistanTuvaluUgandaUkraineUnited Arab EmiratesUnited KingdomUnited StatesUpper middle incomeUruguayUzbekistanVanuatuVenezuela, RBVietnamWest Bank and GazaWorldYemen, Rep.ZambiaZimbabwe Timeline:
This timeline shows a graph from 1971 to 2016 of Norway. No data until 1970. Number of actual observations by date: 46.
Source name:
World Development Indicators
Source organization:
International Monetary Fund, Balance of Payments database, supplemented by data from the United Nations Conference on Trade and Development and official national sources.
Categories, topics:
Economy & Growth, Financial Sector, External Debt
Last updated:
apr 23, 2017
Indicators value changes by year
Minimum:
-4.513 bln
jan 1, 2016
Maximum:
26.866 bln
jan 1, 2013
At the date of observation
Value
Absolute change
Change from previous value
jan 1, 1971
64.0 mln
+64.0 mln
0.0%
jan 1, 1972
94.0 mln
+30.0 mln
46.88%
jan 1, 1973
121.0 mln
+27.0 mln
28.72%
jan 1, 1974
209.0 mln
+88.0 mln
72.73%
jan 1, 1975
346.0 mln
+137.0 mln
65.55%
jan 1, 1976
219.677 mln
-126.323 mln
-36.51%
jan 1, 1977
371.391 mln
+151.714 mln
69.06%
jan 1, 1978
768.296 mln
+396.905 mln
106.87%
jan 1, 1979
489.814 mln
-278.482 mln
-36.25%
jan 1, 1980
401.356 mln
-88.458 mln
-18.06%
jan 1, 1981
59.816 mln
-341.54 mln
-85.1%
jan 1, 1982
671.835 mln
+612.019 mln
1.02K%
jan 1, 1983
442.014 mln
-229.82 mln
-34.21%
jan 1, 1984
328.327 mln
-113.688 mln
-25.72%
jan 1, 1985
-180.453 mln
-508.78 mln
-154.96%
jan 1, 1986
-426.468 mln
-246.014 mln
136.33%
jan 1, 1987
1.017 bln
+1.444 bln
-338.56%
jan 1, 1988
186.765 mln
-830.603 mln
-81.64%
jan 1, 1989
279.336 mln
+92.572 mln
49.57%
jan 1, 1990
1.519 bln
+1.24 bln
443.91%
jan 1, 1991
1.003 bln
-516.208 mln
-33.98%
jan 1, 1992
-397.606 mln
-1.401 bln
-139.64%
jan 1, 1993
-668.115 mln
-270.509 mln
68.03%
jan 1, 1994
991.524 mln
+1.66 bln
-248.41%
jan 1, 1995
2.736 bln
+1.745 bln
175.98%
jan 1, 1996
2.393 bln
-343.627 mln
-12.56%
jan 1, 1997
3.179 bln
+786.26 mln
32.86%
jan 1, 1998
3.886 bln
+707.025 mln
22.24%
jan 1, 1999
4.354 bln
+467.806 mln
12.04%
jan 1, 2000
6.776 bln
+2.422 bln
55.63%
jan 1, 2001
8.332 bln
+1.556 bln
22.97%
jan 1, 2002
3.19 bln
-5.142 bln
-61.71%
jan 1, 2003
3.012 bln
-178.463 mln
-5.59%
jan 1, 2004
4.179 bln
+1.168 bln
38.77%
jan 1, 2005
4.918 bln
+739.115 mln
17.68%
jan 1, 2006
10.059 bln
+5.14 bln
104.51%
jan 1, 2007
11.878 bln
+1.819 bln
18.09%
jan 1, 2008
24.806 bln
+12.928 bln
108.84%
jan 1, 2009
20.578 bln
-4.228 bln
-17.04%
jan 1, 2010
8.636 bln
-11.942 bln
-58.03%
jan 1, 2011
21.634 bln
+12.999 bln
150.52%
jan 1, 2012
10.296 bln
-11.338 bln
-52.41%
jan 1, 2013
26.866 bln
+16.57 bln
160.93%
jan 1, 2014
-275.285 mln
-27.141 bln
-101.02%
jan 1, 2015
6.152 bln
+6.428 bln
-2.33K%
jan 1, 2016
-4.513 bln
-10.666 bln
-173.36%
Ranking of countries by current statistics by years


Comments: