29
/
en
AIzaSyAYiBZKx7MnpbEhh9jyipgxe19OcubqV5w
April 1, 2024
267965
Tunisia
TUN
true
2
1
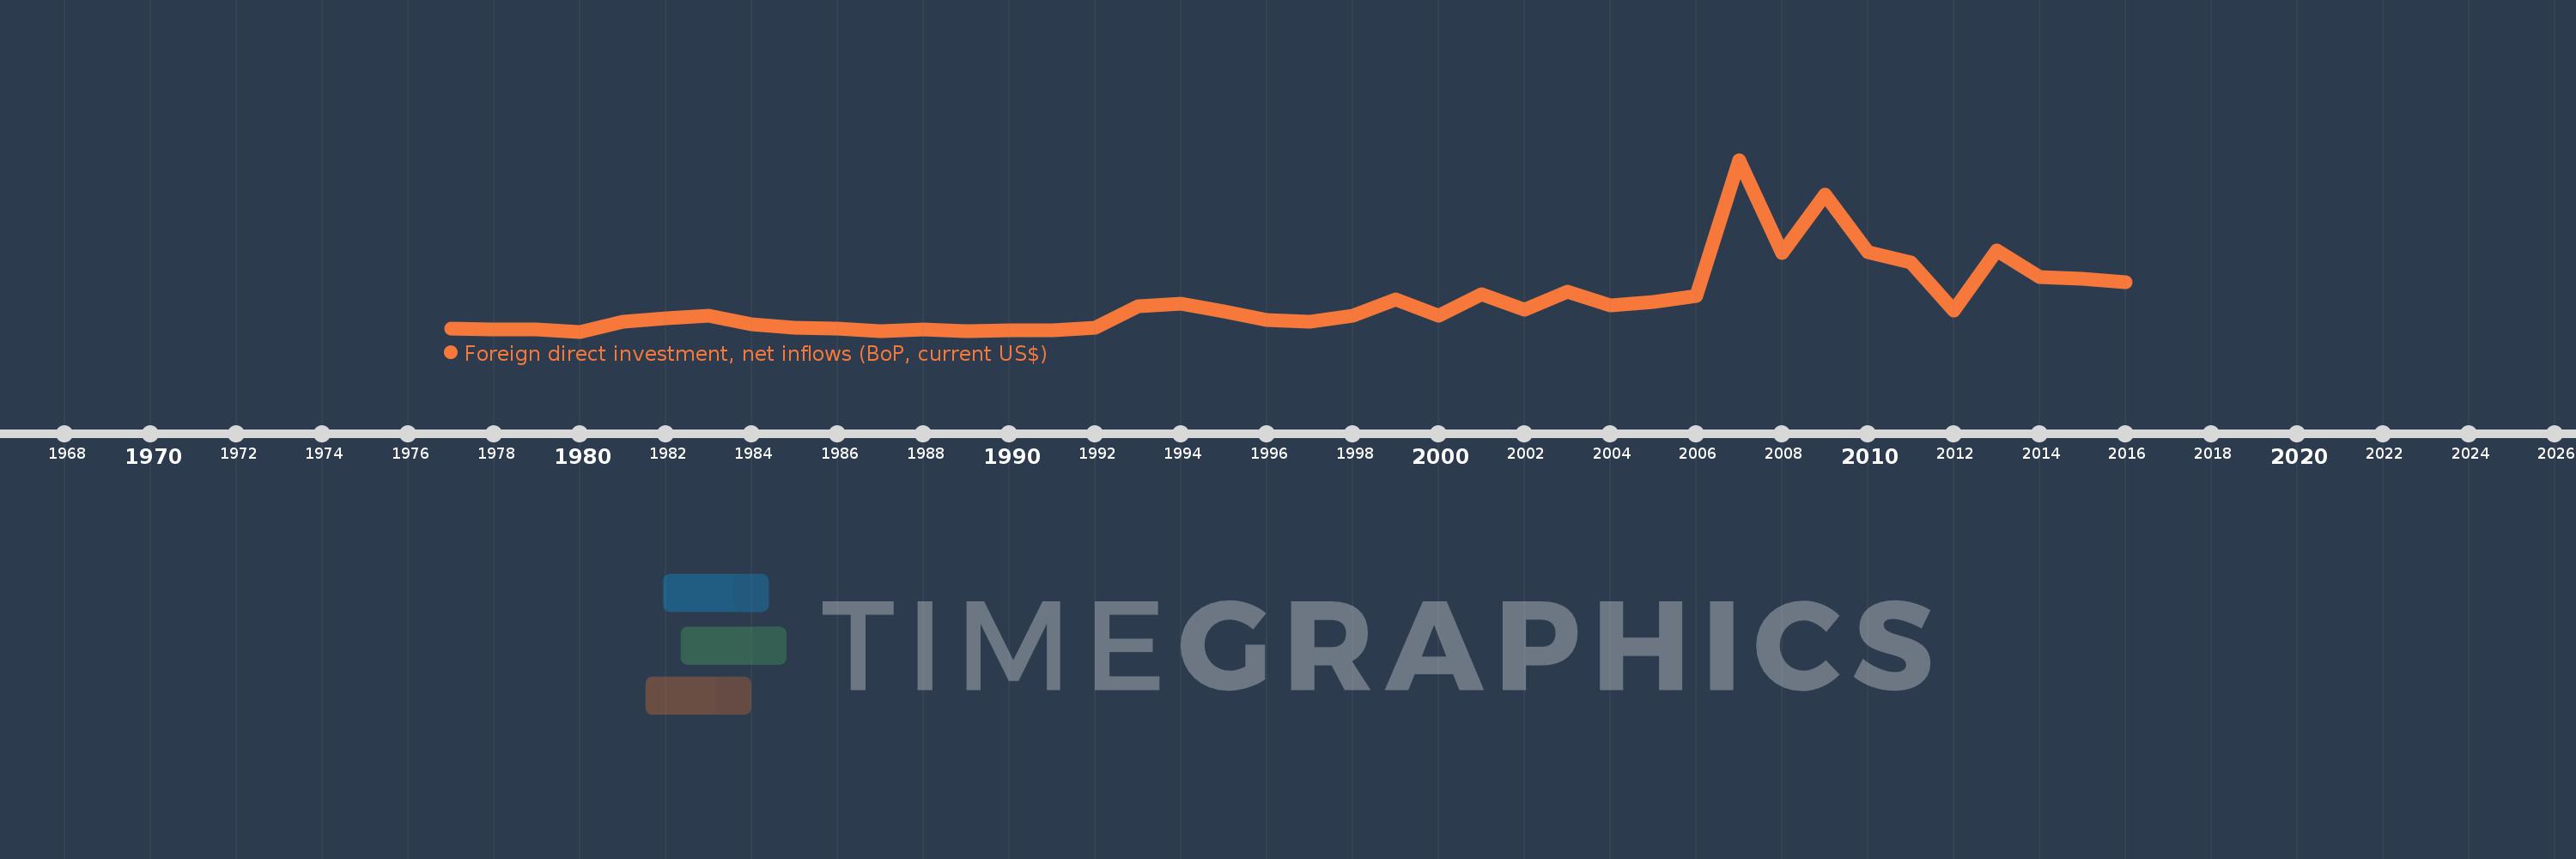
Foreign direct investment, net inflows (BoP, current US$)
2016,2015,2014,2013,2012,2011,2010,2009,2008,2007,2006,2005,2004,2003,2002,2001,2000,1999,1998,1997,1996,1995,1994,1993,1992,1991,1990,1989,1988,1987,1986,1985,1984,1983,1982,1981,1980,1979,1978,1977
This statistics in other country:
AfghanistanAlbaniaAlgeriaAngolaAntigua and BarbudaArab WorldArgentinaArmeniaArubaAustraliaAustriaAzerbaijanBahamas, TheBahrainBangladeshBarbadosBelarusBelgiumBelizeBeninBermudaBhutanBoliviaBosnia and HerzegovinaBotswanaBrazilBritish Virgin IslandsBrunei DarussalamBulgariaBurkina FasoBurundiCabo VerdeCambodiaCameroonCanadaCaribbean small statesCayman IslandsCentral African RepublicCentral Europe and the BalticsChadChileChinaColombiaComorosCongo, Dem. Rep.Congo, Rep.Costa RicaCote d'IvoireCroatiaCuracaoCyprusCzech RepublicDenmarkDjiboutiDominicaDominican RepublicEarly-demographic dividendEast Asia & PacificEast Asia & Pacific (excluding high income)East Asia & Pacific (IDA & IBRD countries)EcuadorEgypt, Arab Rep.El SalvadorEquatorial GuineaEritreaEstoniaEthiopiaEuro areaEurope & Central AsiaEurope & Central Asia (excluding high income)Europe & Central Asia (IDA & IBRD countries)European UnionFijiFinlandFragile and conflict affected situationsFranceFrench PolynesiaGabonGambia, TheGeorgiaGermanyGhanaGibraltarGreeceGrenadaGuatemalaGuineaGuinea-BissauGuyanaHaitiHeavily indebted poor countries (HIPC)High incomeHondurasHong Kong SAR, ChinaHungaryIBRD onlyIcelandIDA & IBRD totalIDA blendIDA onlyIDA totalIndiaIndonesiaIran, Islamic Rep.IraqIrelandIsraelItalyJamaicaJapanJordanKazakhstanKenyaKiribatiKorea, Dem. People’s Rep.Korea, Rep.KosovoKuwaitKyrgyz RepublicLao PDRLate-demographic dividendLatin America & Caribbean Latin America & Caribbean (excluding high income)Latin America & the Caribbean (IDA & IBRD countries)LatviaLeast developed countries: UN classificationLebanonLesothoLiberiaLibyaLithuaniaLow & middle incomeLow incomeLower middle incomeLuxembourgMacao SAR, ChinaMacedonia, FYRMadagascarMalawiMalaysiaMaldivesMaliMaltaMarshall IslandsMauritaniaMauritiusMexicoMicronesia, Fed. Sts.Middle East & North AfricaMiddle East & North Africa (excluding high income)Middle East & North Africa (IDA & IBRD countries)Middle incomeMoldovaMongoliaMontenegroMoroccoMozambiqueMyanmarNamibiaNauruNepalNetherlandsNew CaledoniaNew ZealandNicaraguaNigerNigeriaNorth AmericaNorthern Mariana IslandsNorwayOECD membersOmanOther small statesPacific island small statesPakistanPalauPanamaPapua New GuineaParaguayPeruPhilippinesPolandPortugalPost-demographic dividendPre-demographic dividendQatarRomaniaRussian FederationRwandaSamoaSao Tome and PrincipeSaudi ArabiaSenegalSerbiaSeychellesSierra LeoneSingaporeSint Maarten (Dutch part)Slovak RepublicSloveniaSmall statesSolomon IslandsSomaliaSouth AfricaSouth AsiaSouth Asia (IDA & IBRD)South SudanSpainSri LankaSt. Kitts and NevisSt. LuciaSt. Vincent and the GrenadinesSub-Saharan Africa Sub-Saharan Africa (excluding high income)Sub-Saharan Africa (IDA & IBRD countries)SudanSurinameSwazilandSwedenSwitzerlandSyrian Arab RepublicTajikistanTanzaniaThailandTimor-LesteTogoTongaTrinidad and TobagoTunisiaTurkeyTurkmenistanTuvaluUgandaUkraineUnited Arab EmiratesUnited KingdomUnited StatesUpper middle incomeUruguayUzbekistanVanuatuVenezuela, RBVietnamWest Bank and GazaWorldYemen, Rep.ZambiaZimbabwe Timeline:
This timeline shows a graph from 1977 to 2016 of Tunisia. No data until 1976. Number of actual observations by date: 40.
Source name:
World Development Indicators
Source organization:
International Monetary Fund, Balance of Payments database, supplemented by data from the United Nations Conference on Trade and Development and official national sources.
Categories, topics:
Economy & Growth, Financial Sector, External Debt
Last updated:
apr 23, 2017
Indicators value changes by year
Minimum:
49.205 mln
jan 1, 1980
Maximum:
3.24 bln
jan 1, 2007
At the date of observation
Value
Absolute change
Change from previous value
jan 1, 1977
109.615 mln
+109.615 mln
0.0%
jan 1, 1978
93.251 mln
-16.364 mln
-14.93%
jan 1, 1979
91.309 mln
-1.942 mln
-2.08%
jan 1, 1980
49.205 mln
-42.104 mln
-46.11%
jan 1, 1981
234.594 mln
+185.389 mln
376.77%
jan 1, 1982
295.664 mln
+61.069 mln
26.03%
jan 1, 1983
340.281 mln
+44.618 mln
15.09%
jan 1, 1984
184.158 mln
-156.124 mln
-45.88%
jan 1, 1985
113.28 mln
-70.877 mln
-38.49%
jan 1, 1986
107.85 mln
-5.431 mln
-4.79%
jan 1, 1987
64.229 mln
-43.62 mln
-40.45%
jan 1, 1988
91.714 mln
+27.485 mln
42.79%
jan 1, 1989
60.62 mln
-31.094 mln
-33.9%
jan 1, 1990
77.95 mln
+17.331 mln
28.59%
jan 1, 1991
76.281 mln
-1.67 mln
-2.14%
jan 1, 1992
125.457 mln
+49.176 mln
64.47%
jan 1, 1993
525.76 mln
+400.304 mln
319.08%
jan 1, 1994
561.898 mln
+36.137 mln
6.87%
jan 1, 1995
432.009 mln
-129.889 mln
-23.12%
jan 1, 1996
264.34 mln
-167.668 mln
-38.81%
jan 1, 1997
238.338 mln
-26.003 mln
-9.84%
jan 1, 1998
339.088 mln
+100.75 mln
42.27%
jan 1, 1999
649.85 mln
+310.762 mln
91.65%
jan 1, 2000
349.849 mln
-300.0 mln
-46.16%
jan 1, 2001
750.72 mln
+400.871 mln
114.58%
jan 1, 2002
451.515 mln
-299.206 mln
-39.86%
jan 1, 2003
790.303 mln
+338.788 mln
75.03%
jan 1, 2004
539.482 mln
-250.821 mln
-31.74%
jan 1, 2005
592.148 mln
+52.666 mln
9.76%
jan 1, 2006
712.715 mln
+120.567 mln
20.36%
jan 1, 2007
3.24 bln
+2.527 bln
354.59%
jan 1, 2008
1.515 bln
-1.725 bln
-53.23%
jan 1, 2009
2.601 bln
+1.085 bln
71.62%
jan 1, 2010
1.525 bln
-1.075 bln
-41.35%
jan 1, 2011
1.334 bln
-190.747 mln
-12.51%
jan 1, 2012
432.666 mln
-901.832 mln
-67.58%
jan 1, 2013
1.554 bln
+1.122 bln
259.23%
jan 1, 2014
1.059 bln
-495.647 mln
-31.89%
jan 1, 2015
1.025 bln
-33.868 mln
-3.2%
jan 1, 2016
965.679 mln
-59.075 mln
-5.76%
Ranking of countries by current statistics by years


Comments: