29
/
en
AIzaSyAYiBZKx7MnpbEhh9jyipgxe19OcubqV5w
April 1, 2024
201553
Morocco
MAR
true
2
1
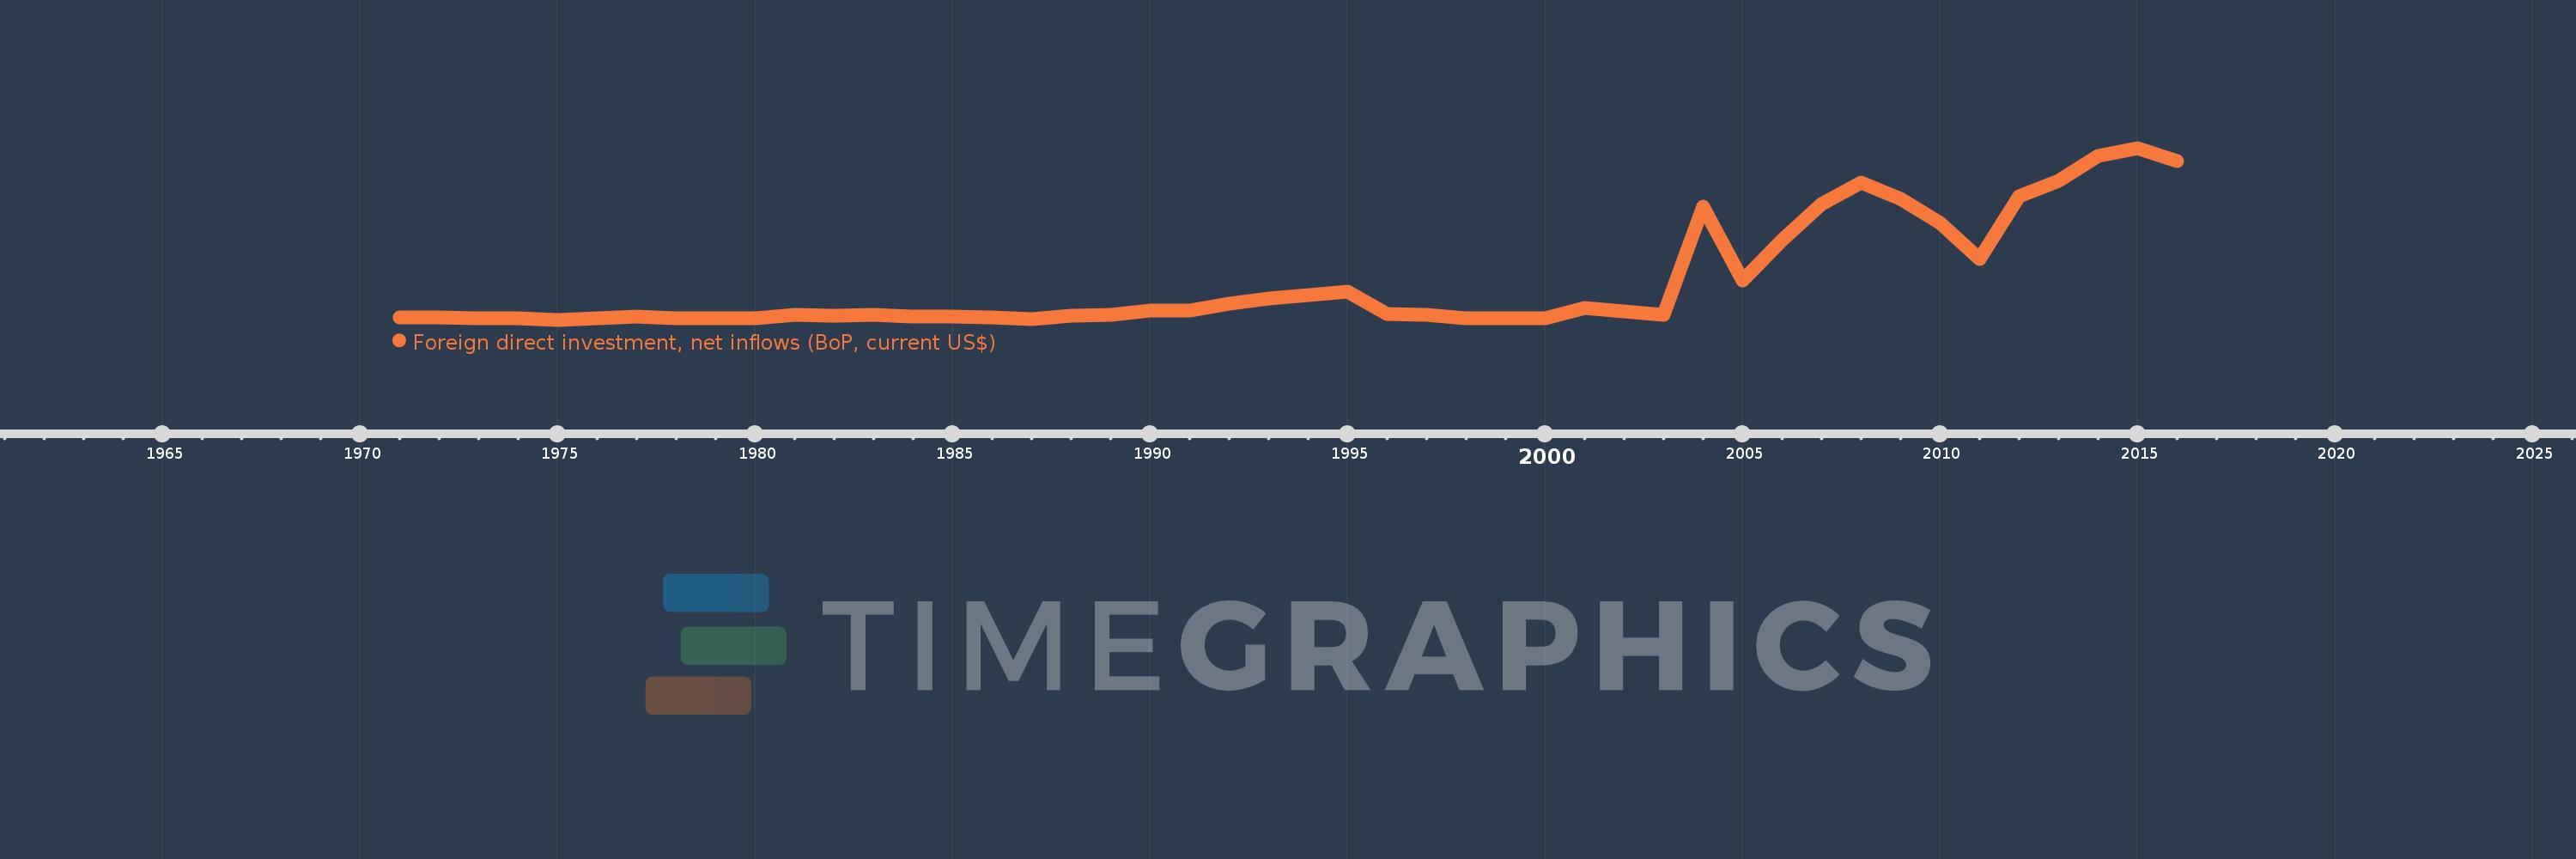
Foreign direct investment, net inflows (BoP, current US$)
2016,2015,2014,2013,2012,2011,2010,2009,2008,2007,2006,2005,2004,2003,2002,2001,2000,1999,1998,1997,1996,1995,1994,1993,1992,1991,1990,1989,1988,1987,1986,1985,1984,1983,1982,1981,1980,1979,1978,1977,1976,1975,1974,1973,1972,1971
This statistics in other country:
AfghanistanAlbaniaAlgeriaAngolaAntigua and BarbudaArab WorldArgentinaArmeniaArubaAustraliaAustriaAzerbaijanBahamas, TheBahrainBangladeshBarbadosBelarusBelgiumBelizeBeninBermudaBhutanBoliviaBosnia and HerzegovinaBotswanaBrazilBritish Virgin IslandsBrunei DarussalamBulgariaBurkina FasoBurundiCabo VerdeCambodiaCameroonCanadaCaribbean small statesCayman IslandsCentral African RepublicCentral Europe and the BalticsChadChileChinaColombiaComorosCongo, Dem. Rep.Congo, Rep.Costa RicaCote d'IvoireCroatiaCuracaoCyprusCzech RepublicDenmarkDjiboutiDominicaDominican RepublicEarly-demographic dividendEast Asia & PacificEast Asia & Pacific (excluding high income)East Asia & Pacific (IDA & IBRD countries)EcuadorEgypt, Arab Rep.El SalvadorEquatorial GuineaEritreaEstoniaEthiopiaEuro areaEurope & Central AsiaEurope & Central Asia (excluding high income)Europe & Central Asia (IDA & IBRD countries)European UnionFijiFinlandFragile and conflict affected situationsFranceFrench PolynesiaGabonGambia, TheGeorgiaGermanyGhanaGibraltarGreeceGrenadaGuatemalaGuineaGuinea-BissauGuyanaHaitiHeavily indebted poor countries (HIPC)High incomeHondurasHong Kong SAR, ChinaHungaryIBRD onlyIcelandIDA & IBRD totalIDA blendIDA onlyIDA totalIndiaIndonesiaIran, Islamic Rep.IraqIrelandIsraelItalyJamaicaJapanJordanKazakhstanKenyaKiribatiKorea, Dem. People’s Rep.Korea, Rep.KosovoKuwaitKyrgyz RepublicLao PDRLate-demographic dividendLatin America & Caribbean Latin America & Caribbean (excluding high income)Latin America & the Caribbean (IDA & IBRD countries)LatviaLeast developed countries: UN classificationLebanonLesothoLiberiaLibyaLithuaniaLow & middle incomeLow incomeLower middle incomeLuxembourgMacao SAR, ChinaMacedonia, FYRMadagascarMalawiMalaysiaMaldivesMaliMaltaMarshall IslandsMauritaniaMauritiusMexicoMicronesia, Fed. Sts.Middle East & North AfricaMiddle East & North Africa (excluding high income)Middle East & North Africa (IDA & IBRD countries)Middle incomeMoldovaMongoliaMontenegroMoroccoMozambiqueMyanmarNamibiaNauruNepalNetherlandsNew CaledoniaNew ZealandNicaraguaNigerNigeriaNorth AmericaNorthern Mariana IslandsNorwayOECD membersOmanOther small statesPacific island small statesPakistanPalauPanamaPapua New GuineaParaguayPeruPhilippinesPolandPortugalPost-demographic dividendPre-demographic dividendQatarRomaniaRussian FederationRwandaSamoaSao Tome and PrincipeSaudi ArabiaSenegalSerbiaSeychellesSierra LeoneSingaporeSint Maarten (Dutch part)Slovak RepublicSloveniaSmall statesSolomon IslandsSomaliaSouth AfricaSouth AsiaSouth Asia (IDA & IBRD)South SudanSpainSri LankaSt. Kitts and NevisSt. LuciaSt. Vincent and the GrenadinesSub-Saharan Africa Sub-Saharan Africa (excluding high income)Sub-Saharan Africa (IDA & IBRD countries)SudanSurinameSwazilandSwedenSwitzerlandSyrian Arab RepublicTajikistanTanzaniaThailandTimor-LesteTogoTongaTrinidad and TobagoTunisiaTurkeyTurkmenistanTuvaluUgandaUkraineUnited Arab EmiratesUnited KingdomUnited StatesUpper middle incomeUruguayUzbekistanVanuatuVenezuela, RBVietnamWest Bank and GazaWorldYemen, Rep.ZambiaZimbabwe Timeline:
This timeline shows a graph from 1971 to 2016 of Morocco. No data until 1970. Number of actual observations by date: 46.
Source name:
World Development Indicators
Source organization:
International Monetary Fund, Balance of Payments database, supplemented by data from the United Nations Conference on Trade and Development and official national sources.
Categories, topics:
Economy & Growth, Financial Sector, External Debt
Last updated:
apr 23, 2017
Indicators value changes by year
Minimum:
-20.4 mln
jan 1, 1975
Maximum:
3.526 bln
jan 1, 2015
At the date of observation
Value
Absolute change
Change from previous value
jan 1, 1971
20.0 mln
+20.0 mln
0.0%
jan 1, 1972
23.1 mln
+3.1 mln
15.5%
jan 1, 1973
13.0 mln
-10.1 mln
-43.72%
jan 1, 1974
5.49 mln
-7.51 mln
-57.77%
jan 1, 1975
-20.4 mln
-25.89 mln
-471.58%
jan 1, 1976
5.02 mln
+25.42 mln
-124.61%
jan 1, 1977
38.015 mln
+32.995 mln
657.27%
jan 1, 1978
7.994 mln
-30.021 mln
-78.97%
jan 1, 1979
11.76 mln
+3.766 mln
47.11%
jan 1, 1980
7.438 mln
-4.322 mln
-36.76%
jan 1, 1981
89.416 mln
+81.979 mln
1.1K%
jan 1, 1982
58.581 mln
-30.835 mln
-34.48%
jan 1, 1983
79.528 mln
+20.947 mln
35.76%
jan 1, 1984
46.124 mln
-33.405 mln
-42.0%
jan 1, 1985
46.989 mln
+865.573K
1.88%
jan 1, 1986
19.975 mln
-27.014 mln
-57.49%
jan 1, 1987
549.182K
-19.426 mln
-97.25%
jan 1, 1988
59.575 mln
+59.026 mln
10.75K%
jan 1, 1989
84.662 mln
+25.087 mln
42.11%
jan 1, 1990
167.056 mln
+82.394 mln
97.32%
jan 1, 1991
165.123 mln
-1.933 mln
-1.16%
jan 1, 1992
317.462 mln
+152.339 mln
92.26%
jan 1, 1993
422.47 mln
+105.008 mln
33.08%
jan 1, 1994
491.466 mln
+68.996 mln
16.33%
jan 1, 1995
550.924 mln
+59.458 mln
12.1%
jan 1, 1996
92.386 mln
-458.538 mln
-83.23%
jan 1, 1997
76.412 mln
-15.974 mln
-17.29%
jan 1, 1998
3.569 mln
-72.844 mln
-95.33%
jan 1, 1999
11.87 mln
+8.301 mln
232.6%
jan 1, 2000
2.652 mln
-9.218 mln
-77.66%
jan 1, 2001
220.74 mln
+218.088 mln
8.22K%
jan 1, 2002
143.838 mln
-76.901 mln
-34.84%
jan 1, 2003
79.161 mln
-64.677 mln
-44.97%
jan 1, 2004
2.313 bln
+2.234 bln
2.82K%
jan 1, 2005
787.054 mln
-1.526 bln
-65.97%
jan 1, 2006
1.62 bln
+832.699 mln
105.8%
jan 1, 2007
2.366 bln
+746.248 mln
46.07%
jan 1, 2008
2.807 bln
+440.642 mln
18.62%
jan 1, 2009
2.466 bln
-340.354 mln
-12.13%
jan 1, 2010
1.97 bln
-495.964 mln
-20.11%
jan 1, 2011
1.241 bln
-729.698 mln
-37.03%
jan 1, 2012
2.521 bln
+1.281 bln
103.23%
jan 1, 2013
2.842 bln
+320.592 mln
12.72%
jan 1, 2014
3.361 bln
+518.956 mln
18.26%
jan 1, 2015
3.526 bln
+164.716 mln
4.9%
jan 1, 2016
3.253 bln
-272.712 mln
-7.74%
Ranking of countries by current statistics by years


Comments: