29
/
en
AIzaSyAYiBZKx7MnpbEhh9jyipgxe19OcubqV5w
April 1, 2024
29074
East Asia & Pacific (IDA & IBRD countries)
TEA
false
2
1
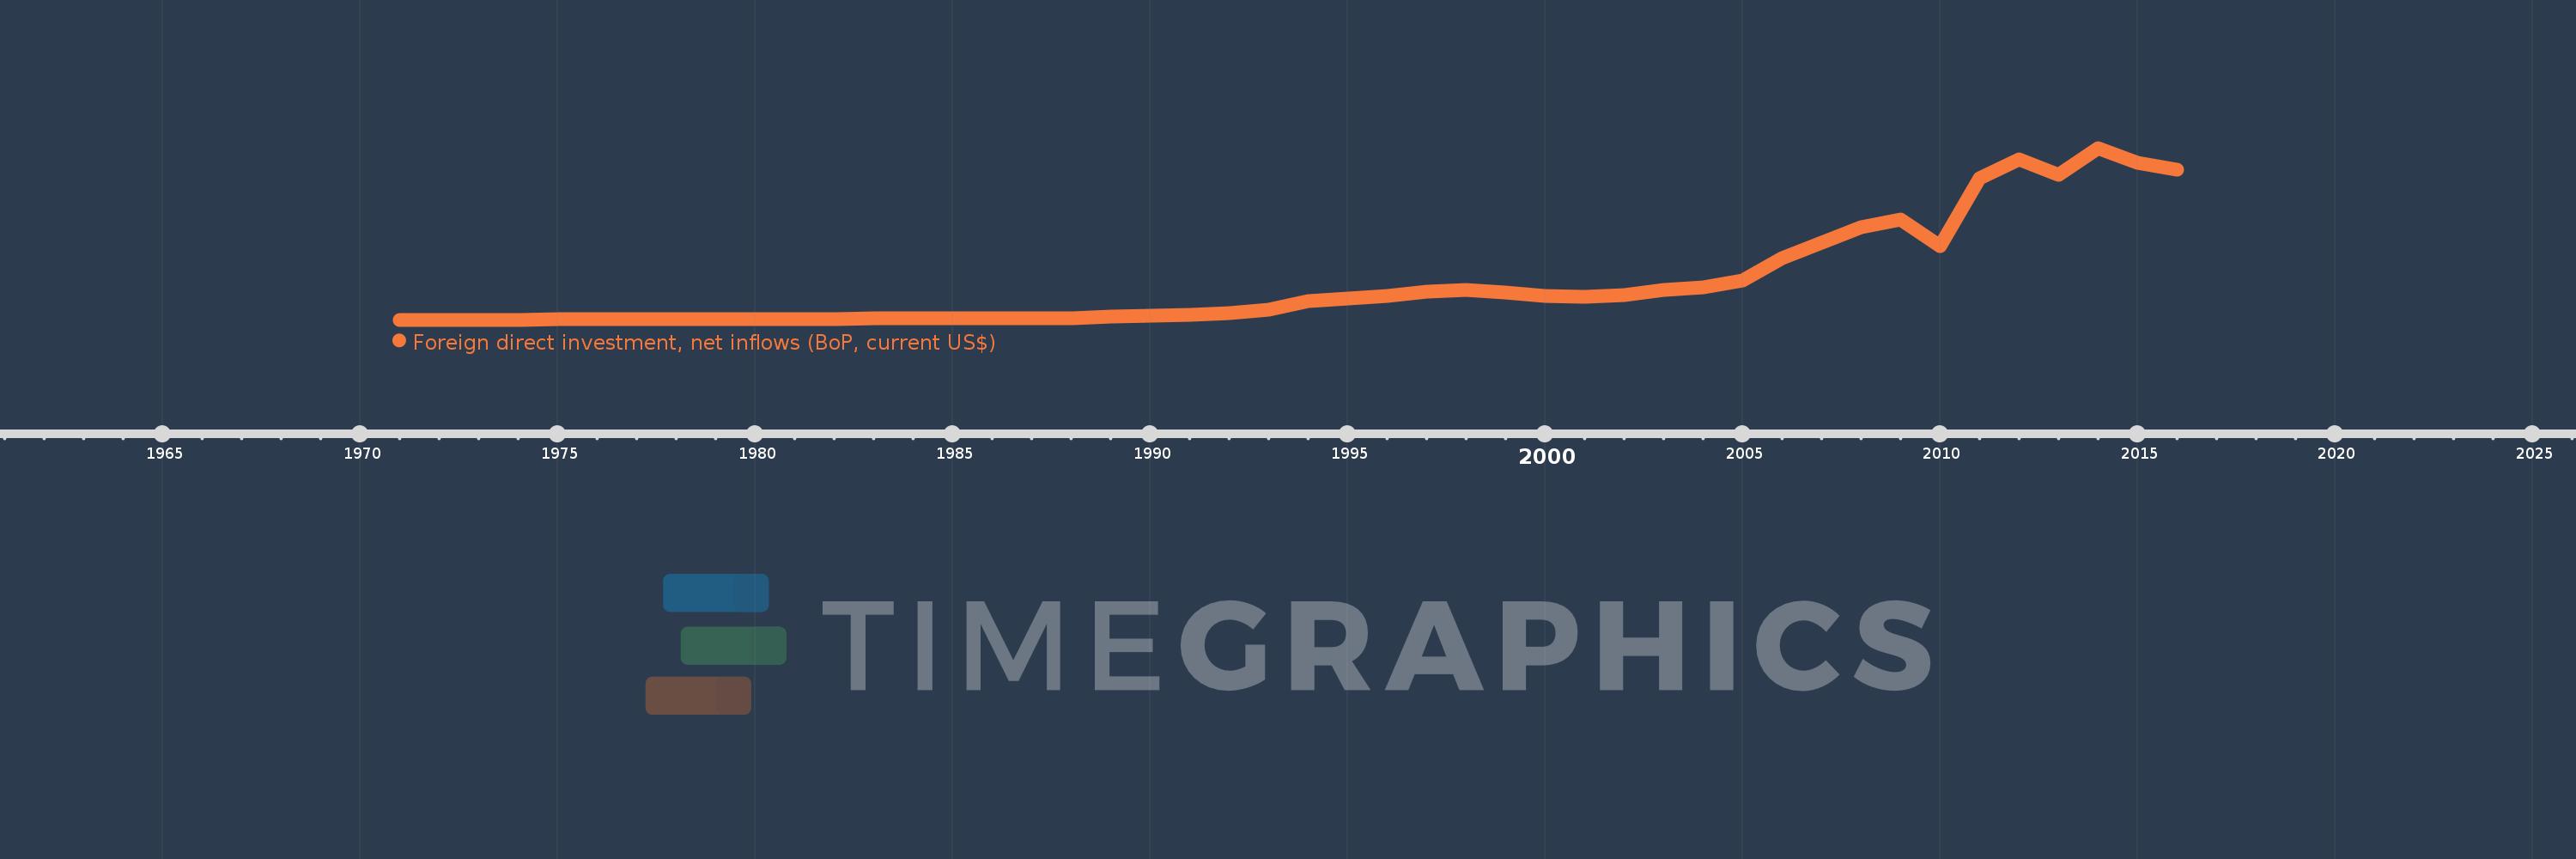
Foreign direct investment, net inflows (BoP, current US$)
2016,2015,2014,2013,2012,2011,2010,2009,2008,2007,2006,2005,2004,2003,2002,2001,2000,1999,1998,1997,1996,1995,1994,1993,1992,1991,1990,1989,1988,1987,1986,1985,1984,1983,1982,1981,1980,1979,1978,1977,1976,1975,1974,1973,1972,1971
This statistics in other country:
AfghanistanAlbaniaAlgeriaAngolaAntigua and BarbudaArab WorldArgentinaArmeniaArubaAustraliaAustriaAzerbaijanBahamas, TheBahrainBangladeshBarbadosBelarusBelgiumBelizeBeninBermudaBhutanBoliviaBosnia and HerzegovinaBotswanaBrazilBritish Virgin IslandsBrunei DarussalamBulgariaBurkina FasoBurundiCabo VerdeCambodiaCameroonCanadaCaribbean small statesCayman IslandsCentral African RepublicCentral Europe and the BalticsChadChileChinaColombiaComorosCongo, Dem. Rep.Congo, Rep.Costa RicaCote d'IvoireCroatiaCuracaoCyprusCzech RepublicDenmarkDjiboutiDominicaDominican RepublicEarly-demographic dividendEast Asia & PacificEast Asia & Pacific (excluding high income)East Asia & Pacific (IDA & IBRD countries)EcuadorEgypt, Arab Rep.El SalvadorEquatorial GuineaEritreaEstoniaEthiopiaEuro areaEurope & Central AsiaEurope & Central Asia (excluding high income)Europe & Central Asia (IDA & IBRD countries)European UnionFijiFinlandFragile and conflict affected situationsFranceFrench PolynesiaGabonGambia, TheGeorgiaGermanyGhanaGibraltarGreeceGrenadaGuatemalaGuineaGuinea-BissauGuyanaHaitiHeavily indebted poor countries (HIPC)High incomeHondurasHong Kong SAR, ChinaHungaryIBRD onlyIcelandIDA & IBRD totalIDA blendIDA onlyIDA totalIndiaIndonesiaIran, Islamic Rep.IraqIrelandIsraelItalyJamaicaJapanJordanKazakhstanKenyaKiribatiKorea, Dem. People’s Rep.Korea, Rep.KosovoKuwaitKyrgyz RepublicLao PDRLate-demographic dividendLatin America & Caribbean Latin America & Caribbean (excluding high income)Latin America & the Caribbean (IDA & IBRD countries)LatviaLeast developed countries: UN classificationLebanonLesothoLiberiaLibyaLithuaniaLow & middle incomeLow incomeLower middle incomeLuxembourgMacao SAR, ChinaMacedonia, FYRMadagascarMalawiMalaysiaMaldivesMaliMaltaMarshall IslandsMauritaniaMauritiusMexicoMicronesia, Fed. Sts.Middle East & North AfricaMiddle East & North Africa (excluding high income)Middle East & North Africa (IDA & IBRD countries)Middle incomeMoldovaMongoliaMontenegroMoroccoMozambiqueMyanmarNamibiaNauruNepalNetherlandsNew CaledoniaNew ZealandNicaraguaNigerNigeriaNorth AmericaNorthern Mariana IslandsNorwayOECD membersOmanOther small statesPacific island small statesPakistanPalauPanamaPapua New GuineaParaguayPeruPhilippinesPolandPortugalPost-demographic dividendPre-demographic dividendQatarRomaniaRussian FederationRwandaSamoaSao Tome and PrincipeSaudi ArabiaSenegalSerbiaSeychellesSierra LeoneSingaporeSint Maarten (Dutch part)Slovak RepublicSloveniaSmall statesSolomon IslandsSomaliaSouth AfricaSouth AsiaSouth Asia (IDA & IBRD)South SudanSpainSri LankaSt. Kitts and NevisSt. LuciaSt. Vincent and the GrenadinesSub-Saharan Africa Sub-Saharan Africa (excluding high income)Sub-Saharan Africa (IDA & IBRD countries)SudanSurinameSwazilandSwedenSwitzerlandSyrian Arab RepublicTajikistanTanzaniaThailandTimor-LesteTogoTongaTrinidad and TobagoTunisiaTurkeyTurkmenistanTuvaluUgandaUkraineUnited Arab EmiratesUnited KingdomUnited StatesUpper middle incomeUruguayUzbekistanVanuatuVenezuela, RBVietnamWest Bank and GazaWorldYemen, Rep.ZambiaZimbabwe Timeline:
This timeline shows a graph from 1971 to 2016 of East Asia & Pacific (IDA & IBRD countries). No data until 1970. Number of actual observations by date: 46.
Source name:
World Development Indicators
Source organization:
International Monetary Fund, Balance of Payments database, supplemented by data from the United Nations Conference on Trade and Development and official national sources.
Categories, topics:
Economy & Growth, Financial Sector, External Debt
Last updated:
apr 23, 2017
Indicators value changes by year
Minimum:
170.8 mln
jan 1, 1972
Maximum:
360.701 bln
jan 1, 2014
At the date of observation
Value
Absolute change
Change from previous value
jan 1, 1971
222.7 mln
+222.7 mln
0.0%
jan 1, 1972
170.8 mln
-51.9 mln
-23.3%
jan 1, 1973
203.415 mln
+32.615 mln
19.1%
jan 1, 1974
347.775 mln
+144.36 mln
70.97%
jan 1, 1975
778.419 mln
+430.644 mln
123.83%
jan 1, 1976
566.412 mln
-212.007 mln
-27.24%
jan 1, 1977
649.42 mln
+83.008 mln
14.66%
jan 1, 1978
748.941 mln
+99.521 mln
15.32%
jan 1, 1979
705.873 mln
-43.068 mln
-5.75%
jan 1, 1980
698.476 mln
-7.397 mln
-1.05%
jan 1, 1981
1.139 bln
+440.461 mln
63.06%
jan 1, 1982
2.008 bln
+869.195 mln
76.32%
jan 1, 1983
2.403 bln
+394.822 mln
19.66%
jan 1, 1984
2.819 bln
+416.007 mln
17.31%
jan 1, 1985
2.837 bln
+18.439 mln
0.65%
jan 1, 1986
2.948 bln
+110.915 mln
3.91%
jan 1, 1987
3.116 bln
+167.423 mln
5.68%
jan 1, 1988
3.923 bln
+807.23 mln
25.91%
jan 1, 1989
6.738 bln
+2.815 bln
71.77%
jan 1, 1990
8.332 bln
+1.593 bln
23.64%
jan 1, 1991
10.514 bln
+2.182 bln
26.19%
jan 1, 1992
13.205 bln
+2.691 bln
25.6%
jan 1, 1993
21.404 bln
+8.199 bln
62.09%
jan 1, 1994
38.899 bln
+17.496 bln
81.74%
jan 1, 1995
45.564 bln
+6.665 bln
17.13%
jan 1, 1996
50.797 bln
+5.233 bln
11.48%
jan 1, 1997
58.563 bln
+7.766 bln
15.29%
jan 1, 1998
62.303 bln
+3.74 bln
6.39%
jan 1, 1999
57.819 bln
-4.484 bln
-7.2%
jan 1, 2000
50.409 bln
-7.409 bln
-12.81%
jan 1, 2001
48.202 bln
-2.207 bln
-4.38%
jan 1, 2002
52.551 bln
+4.349 bln
9.02%
jan 1, 2003
63.291 bln
+10.74 bln
20.44%
jan 1, 2004
68.503 bln
+5.211 bln
8.23%
jan 1, 2005
83.223 bln
+14.72 bln
21.49%
jan 1, 2006
129.284 bln
+46.061 bln
55.35%
jan 1, 2007
161.733 bln
+32.449 bln
25.1%
jan 1, 2008
193.445 bln
+31.711 bln
19.61%
jan 1, 2009
211.177 bln
+17.733 bln
9.17%
jan 1, 2010
155.402 bln
-55.775 bln
-26.41%
jan 1, 2011
297.945 bln
+142.542 bln
91.72%
jan 1, 2012
336.195 bln
+38.251 bln
12.84%
jan 1, 2013
303.629 bln
-32.566 bln
-9.69%
jan 1, 2014
360.701 bln
+57.072 bln
18.8%
jan 1, 2015
329.451 bln
-31.25 bln
-8.66%
jan 1, 2016
315.103 bln
-14.349 bln
-4.36%
Ranking of countries by current statistics by years


Comments: