29
/
en
AIzaSyAYiBZKx7MnpbEhh9jyipgxe19OcubqV5w
April 1, 2024
118892
Denmark
DNK
true
2
1
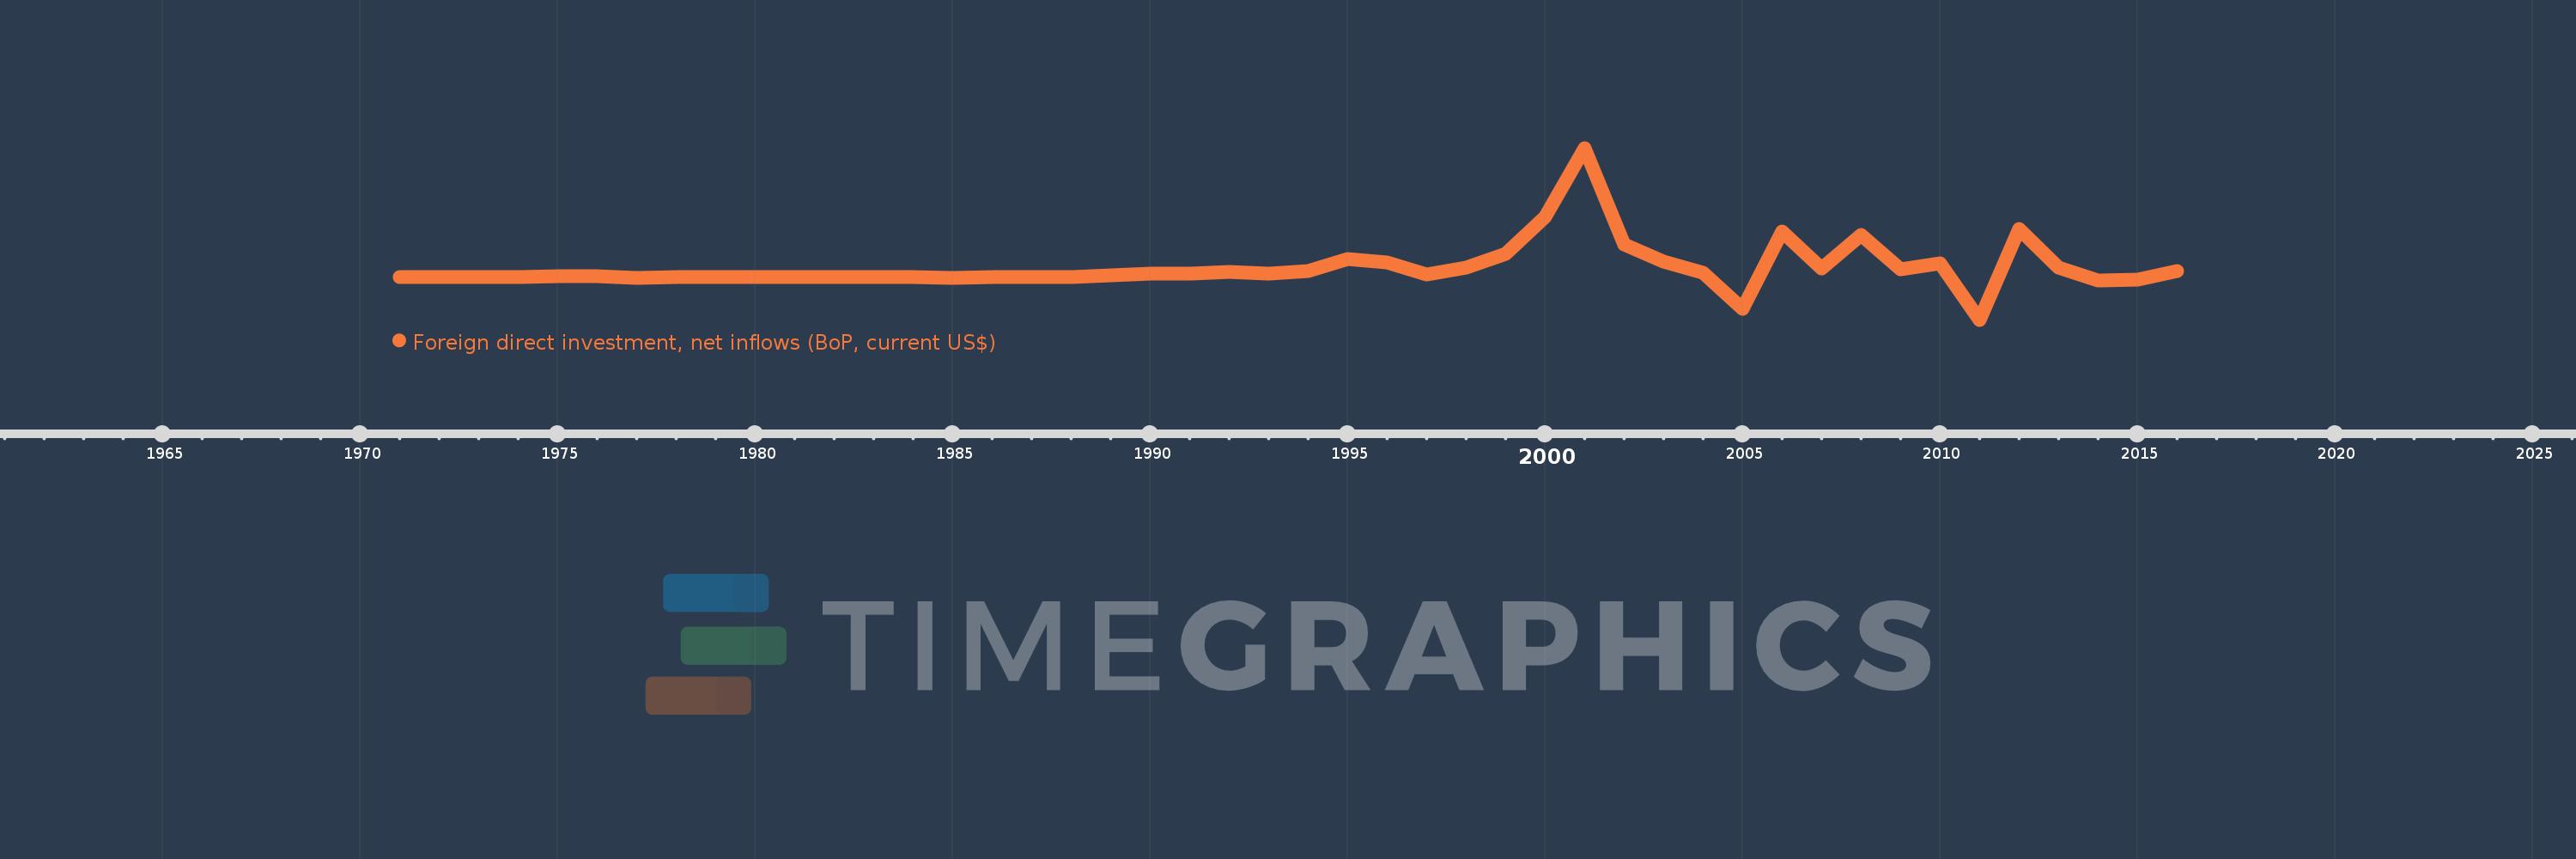
Foreign direct investment, net inflows (BoP, current US$)
2016,2015,2014,2013,2012,2011,2010,2009,2008,2007,2006,2005,2004,2003,2002,2001,2000,1999,1998,1997,1996,1995,1994,1993,1992,1991,1990,1989,1988,1987,1986,1985,1984,1983,1982,1981,1980,1979,1978,1977,1976,1975,1974,1973,1972,1971
This statistics in other country:
AfghanistanAlbaniaAlgeriaAngolaAntigua and BarbudaArab WorldArgentinaArmeniaArubaAustraliaAustriaAzerbaijanBahamas, TheBahrainBangladeshBarbadosBelarusBelgiumBelizeBeninBermudaBhutanBoliviaBosnia and HerzegovinaBotswanaBrazilBritish Virgin IslandsBrunei DarussalamBulgariaBurkina FasoBurundiCabo VerdeCambodiaCameroonCanadaCaribbean small statesCayman IslandsCentral African RepublicCentral Europe and the BalticsChadChileChinaColombiaComorosCongo, Dem. Rep.Congo, Rep.Costa RicaCote d'IvoireCroatiaCuracaoCyprusCzech RepublicDenmarkDjiboutiDominicaDominican RepublicEarly-demographic dividendEast Asia & PacificEast Asia & Pacific (excluding high income)East Asia & Pacific (IDA & IBRD countries)EcuadorEgypt, Arab Rep.El SalvadorEquatorial GuineaEritreaEstoniaEthiopiaEuro areaEurope & Central AsiaEurope & Central Asia (excluding high income)Europe & Central Asia (IDA & IBRD countries)European UnionFijiFinlandFragile and conflict affected situationsFranceFrench PolynesiaGabonGambia, TheGeorgiaGermanyGhanaGibraltarGreeceGrenadaGuatemalaGuineaGuinea-BissauGuyanaHaitiHeavily indebted poor countries (HIPC)High incomeHondurasHong Kong SAR, ChinaHungaryIBRD onlyIcelandIDA & IBRD totalIDA blendIDA onlyIDA totalIndiaIndonesiaIran, Islamic Rep.IraqIrelandIsraelItalyJamaicaJapanJordanKazakhstanKenyaKiribatiKorea, Dem. People’s Rep.Korea, Rep.KosovoKuwaitKyrgyz RepublicLao PDRLate-demographic dividendLatin America & Caribbean Latin America & Caribbean (excluding high income)Latin America & the Caribbean (IDA & IBRD countries)LatviaLeast developed countries: UN classificationLebanonLesothoLiberiaLibyaLithuaniaLow & middle incomeLow incomeLower middle incomeLuxembourgMacao SAR, ChinaMacedonia, FYRMadagascarMalawiMalaysiaMaldivesMaliMaltaMarshall IslandsMauritaniaMauritiusMexicoMicronesia, Fed. Sts.Middle East & North AfricaMiddle East & North Africa (excluding high income)Middle East & North Africa (IDA & IBRD countries)Middle incomeMoldovaMongoliaMontenegroMoroccoMozambiqueMyanmarNamibiaNauruNepalNetherlandsNew CaledoniaNew ZealandNicaraguaNigerNigeriaNorth AmericaNorthern Mariana IslandsNorwayOECD membersOmanOther small statesPacific island small statesPakistanPalauPanamaPapua New GuineaParaguayPeruPhilippinesPolandPortugalPost-demographic dividendPre-demographic dividendQatarRomaniaRussian FederationRwandaSamoaSao Tome and PrincipeSaudi ArabiaSenegalSerbiaSeychellesSierra LeoneSingaporeSint Maarten (Dutch part)Slovak RepublicSloveniaSmall statesSolomon IslandsSomaliaSouth AfricaSouth AsiaSouth Asia (IDA & IBRD)South SudanSpainSri LankaSt. Kitts and NevisSt. LuciaSt. Vincent and the GrenadinesSub-Saharan Africa Sub-Saharan Africa (excluding high income)Sub-Saharan Africa (IDA & IBRD countries)SudanSurinameSwazilandSwedenSwitzerlandSyrian Arab RepublicTajikistanTanzaniaThailandTimor-LesteTogoTongaTrinidad and TobagoTunisiaTurkeyTurkmenistanTuvaluUgandaUkraineUnited Arab EmiratesUnited KingdomUnited StatesUpper middle incomeUruguayUzbekistanVanuatuVenezuela, RBVietnamWest Bank and GazaWorldYemen, Rep.ZambiaZimbabwe Timeline:
This timeline shows a graph from 1971 to 2016 of Denmark. No data until 1970. Number of actual observations by date: 46.
Source name:
World Development Indicators
Source organization:
International Monetary Fund, Balance of Payments database, supplemented by data from the United Nations Conference on Trade and Development and official national sources.
Categories, topics:
Economy & Growth, Financial Sector, External Debt
Last updated:
apr 23, 2017
Indicators value changes by year
Minimum:
-11.766 bln
jan 1, 2011
Maximum:
36.013 bln
jan 1, 2001
At the date of observation
Value
Absolute change
Change from previous value
jan 1, 1971
104.0 mln
+104.0 mln
0.0%
jan 1, 1972
125.0 mln
+21.0 mln
20.19%
jan 1, 1973
164.0 mln
+39.0 mln
31.2%
jan 1, 1974
212.0 mln
+48.0 mln
29.27%
jan 1, 1975
240.0 mln
+28.0 mln
13.21%
jan 1, 1976
266.942 mln
+26.942 mln
11.23%
jan 1, 1977
-190.296 mln
-457.238 mln
-171.29%
jan 1, 1978
75.8 mln
+266.095 mln
-139.83%
jan 1, 1979
89.465 mln
+13.665 mln
18.03%
jan 1, 1980
223.893 mln
+134.428 mln
150.26%
jan 1, 1981
104.12 mln
-119.774 mln
-53.5%
jan 1, 1982
99.454 mln
-4.665 mln
-4.48%
jan 1, 1983
133.85 mln
+34.396 mln
34.58%
jan 1, 1984
60.131 mln
-73.719 mln
-55.08%
jan 1, 1985
-15.357 mln
-75.488 mln
-125.54%
jan 1, 1986
111.103 mln
+126.46 mln
-823.48%
jan 1, 1987
163.266 mln
+52.163 mln
46.95%
jan 1, 1988
84.661 mln
-78.606 mln
-48.15%
jan 1, 1989
503.338 mln
+418.677 mln
494.53%
jan 1, 1990
1.09 bln
+586.227 mln
116.47%
jan 1, 1991
1.132 bln
+42.581 mln
3.91%
jan 1, 1992
1.553 bln
+420.369 mln
37.13%
jan 1, 1993
1.017 bln
-535.13 mln
-34.47%
jan 1, 1994
1.713 bln
+695.381 mln
68.35%
jan 1, 1995
5.006 bln
+3.293 bln
192.29%
jan 1, 1996
4.139 bln
-866.755 mln
-17.31%
jan 1, 1997
773.444 mln
-3.366 bln
-81.32%
jan 1, 1998
2.792 bln
+2.018 bln
260.94%
jan 1, 1999
6.675 bln
+3.883 bln
139.09%
jan 1, 2000
16.848 bln
+10.173 bln
152.42%
jan 1, 2001
36.013 bln
+19.165 bln
113.76%
jan 1, 2002
9.286 bln
-26.727 bln
-74.21%
jan 1, 2003
4.431 bln
-4.856 bln
-52.29%
jan 1, 2004
1.185 bln
-3.246 bln
-73.26%
jan 1, 2005
-8.804 bln
-9.989 bln
-843.08%
jan 1, 2006
12.834 bln
+21.638 bln
-245.77%
jan 1, 2007
2.42 bln
-10.414 bln
-81.14%
jan 1, 2008
11.809 bln
+9.39 bln
388.01%
jan 1, 2009
2.191 bln
-9.618 bln
-81.45%
jan 1, 2010
3.918 bln
+1.727 bln
78.82%
jan 1, 2011
-11.766 bln
-15.685 bln
-400.3%
jan 1, 2012
13.556 bln
+25.322 bln
-215.21%
jan 1, 2013
2.754 bln
-10.802 bln
-79.68%
jan 1, 2014
-862.219 mln
-3.616 bln
-131.31%
jan 1, 2015
-677.385 mln
+184.834 mln
-21.44%
jan 1, 2016
1.671 bln
+2.348 bln
-346.69%
Ranking of countries by current statistics by years


Comments: