29
/
en
AIzaSyAYiBZKx7MnpbEhh9jyipgxe19OcubqV5w
April 1, 2024
91127
Brazil
BRA
true
2
1
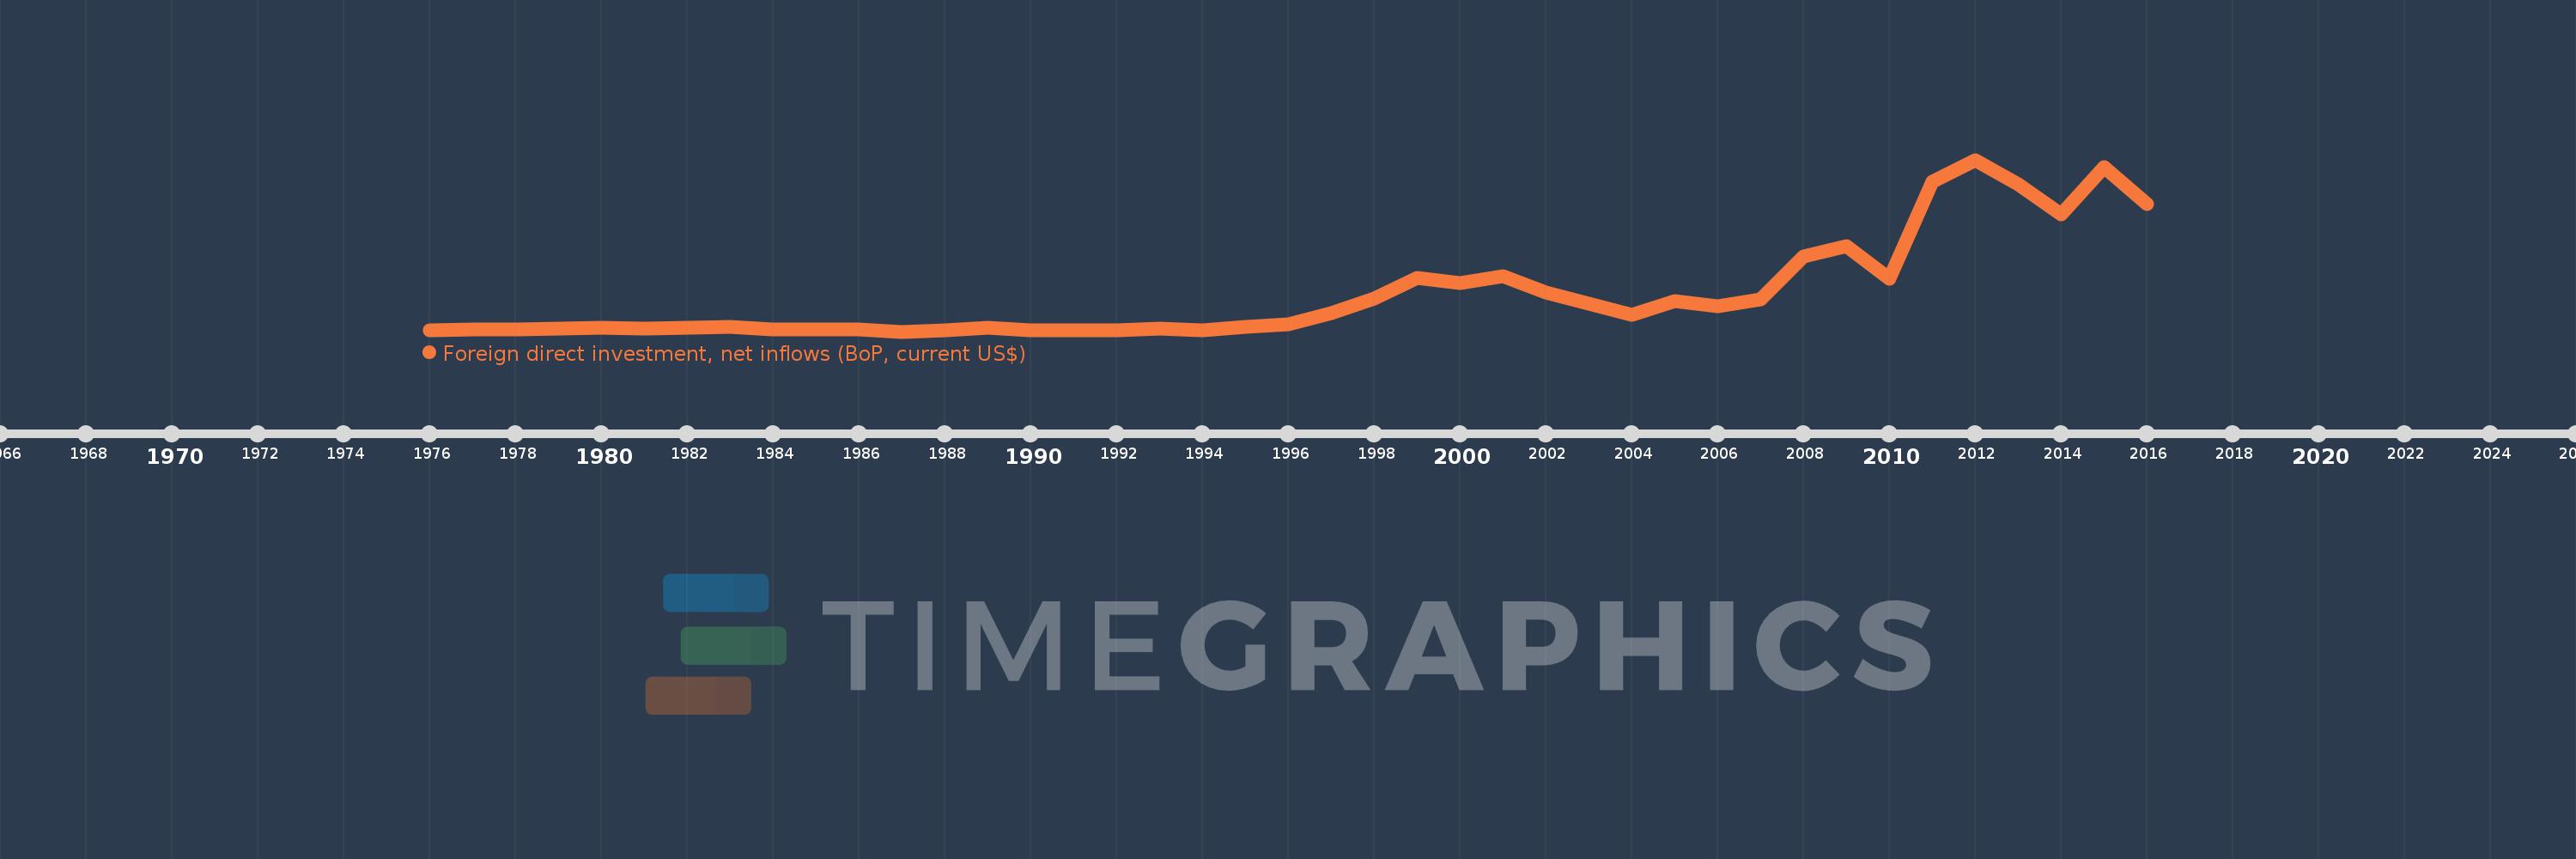
Foreign direct investment, net inflows (BoP, current US$)
2016,2015,2014,2013,2012,2011,2010,2009,2008,2007,2006,2005,2004,2003,2002,2001,2000,1999,1998,1997,1996,1995,1994,1993,1992,1991,1990,1989,1988,1987,1986,1985,1984,1983,1982,1981,1980,1979,1978,1977,1976
This statistics in other country:
AfghanistanAlbaniaAlgeriaAngolaAntigua and BarbudaArab WorldArgentinaArmeniaArubaAustraliaAustriaAzerbaijanBahamas, TheBahrainBangladeshBarbadosBelarusBelgiumBelizeBeninBermudaBhutanBoliviaBosnia and HerzegovinaBotswanaBrazilBritish Virgin IslandsBrunei DarussalamBulgariaBurkina FasoBurundiCabo VerdeCambodiaCameroonCanadaCaribbean small statesCayman IslandsCentral African RepublicCentral Europe and the BalticsChadChileChinaColombiaComorosCongo, Dem. Rep.Congo, Rep.Costa RicaCote d'IvoireCroatiaCuracaoCyprusCzech RepublicDenmarkDjiboutiDominicaDominican RepublicEarly-demographic dividendEast Asia & PacificEast Asia & Pacific (excluding high income)East Asia & Pacific (IDA & IBRD countries)EcuadorEgypt, Arab Rep.El SalvadorEquatorial GuineaEritreaEstoniaEthiopiaEuro areaEurope & Central AsiaEurope & Central Asia (excluding high income)Europe & Central Asia (IDA & IBRD countries)European UnionFijiFinlandFragile and conflict affected situationsFranceFrench PolynesiaGabonGambia, TheGeorgiaGermanyGhanaGibraltarGreeceGrenadaGuatemalaGuineaGuinea-BissauGuyanaHaitiHeavily indebted poor countries (HIPC)High incomeHondurasHong Kong SAR, ChinaHungaryIBRD onlyIcelandIDA & IBRD totalIDA blendIDA onlyIDA totalIndiaIndonesiaIran, Islamic Rep.IraqIrelandIsraelItalyJamaicaJapanJordanKazakhstanKenyaKiribatiKorea, Dem. People’s Rep.Korea, Rep.KosovoKuwaitKyrgyz RepublicLao PDRLate-demographic dividendLatin America & Caribbean Latin America & Caribbean (excluding high income)Latin America & the Caribbean (IDA & IBRD countries)LatviaLeast developed countries: UN classificationLebanonLesothoLiberiaLibyaLithuaniaLow & middle incomeLow incomeLower middle incomeLuxembourgMacao SAR, ChinaMacedonia, FYRMadagascarMalawiMalaysiaMaldivesMaliMaltaMarshall IslandsMauritaniaMauritiusMexicoMicronesia, Fed. Sts.Middle East & North AfricaMiddle East & North Africa (excluding high income)Middle East & North Africa (IDA & IBRD countries)Middle incomeMoldovaMongoliaMontenegroMoroccoMozambiqueMyanmarNamibiaNauruNepalNetherlandsNew CaledoniaNew ZealandNicaraguaNigerNigeriaNorth AmericaNorthern Mariana IslandsNorwayOECD membersOmanOther small statesPacific island small statesPakistanPalauPanamaPapua New GuineaParaguayPeruPhilippinesPolandPortugalPost-demographic dividendPre-demographic dividendQatarRomaniaRussian FederationRwandaSamoaSao Tome and PrincipeSaudi ArabiaSenegalSerbiaSeychellesSierra LeoneSingaporeSint Maarten (Dutch part)Slovak RepublicSloveniaSmall statesSolomon IslandsSomaliaSouth AfricaSouth AsiaSouth Asia (IDA & IBRD)South SudanSpainSri LankaSt. Kitts and NevisSt. LuciaSt. Vincent and the GrenadinesSub-Saharan Africa Sub-Saharan Africa (excluding high income)Sub-Saharan Africa (IDA & IBRD countries)SudanSurinameSwazilandSwedenSwitzerlandSyrian Arab RepublicTajikistanTanzaniaThailandTimor-LesteTogoTongaTrinidad and TobagoTunisiaTurkeyTurkmenistanTuvaluUgandaUkraineUnited Arab EmiratesUnited KingdomUnited StatesUpper middle incomeUruguayUzbekistanVanuatuVenezuela, RBVietnamWest Bank and GazaWorldYemen, Rep.ZambiaZimbabwe Timeline:
This timeline shows a graph from 1976 to 2016 of Brazil. No data until 1975. Number of actual observations by date: 41.
Source name:
World Development Indicators
Source organization:
International Monetary Fund, Balance of Payments database, supplemented by data from the United Nations Conference on Trade and Development and official national sources.
Categories, topics:
Economy & Growth, Financial Sector, External Debt
Last updated:
apr 23, 2017
Indicators value changes by year
Minimum:
345.0 mln
jan 1, 1987
Maximum:
101.158 bln
jan 1, 2012
At the date of observation
Value
Absolute change
Change from previous value
jan 1, 1976
1.302 bln
+1.302 bln
0.0%
jan 1, 1977
1.555 bln
+253.0 mln
19.43%
jan 1, 1978
1.833 bln
+278.0 mln
17.88%
jan 1, 1979
2.006 bln
+173.0 mln
9.44%
jan 1, 1980
2.419 bln
+413.0 mln
20.59%
jan 1, 1981
1.911 bln
-508.0 mln
-21.0%
jan 1, 1982
2.52 bln
+609.0 mln
31.87%
jan 1, 1983
2.91 bln
+390.0 mln
15.48%
jan 1, 1984
1.609 bln
-1.301 bln
-44.71%
jan 1, 1985
1.594 bln
-15.0 mln
-0.93%
jan 1, 1986
1.441 bln
-153.0 mln
-9.6%
jan 1, 1987
345.0 mln
-1.096 bln
-76.06%
jan 1, 1988
1.169 bln
+824.0 mln
238.84%
jan 1, 1989
2.804 bln
+1.635 bln
139.86%
jan 1, 1990
1.131 bln
-1.673 bln
-59.66%
jan 1, 1991
989.0 mln
-142.0 mln
-12.56%
jan 1, 1992
1.103 bln
+114.0 mln
11.53%
jan 1, 1993
2.061 bln
+958.0 mln
86.85%
jan 1, 1994
1.292 bln
-769.0 mln
-37.31%
jan 1, 1995
3.072 bln
+1.78 bln
137.77%
jan 1, 1996
4.859 bln
+1.787 bln
58.17%
jan 1, 1997
11.2 bln
+6.341 bln
130.5%
jan 1, 1998
19.65 bln
+8.45 bln
75.45%
jan 1, 1999
31.913 bln
+12.263 bln
62.41%
jan 1, 2000
28.576 bln
-3.337 bln
-10.46%
jan 1, 2001
32.995 bln
+4.419 bln
15.46%
jan 1, 2002
23.226 bln
-9.769 bln
-29.61%
jan 1, 2003
16.587 bln
-6.639 bln
-28.59%
jan 1, 2004
10.123 bln
-6.464 bln
-38.97%
jan 1, 2005
18.181 bln
+8.058 bln
79.6%
jan 1, 2006
15.46 bln
-2.721 bln
-14.97%
jan 1, 2007
19.378 bln
+3.918 bln
25.34%
jan 1, 2008
44.579 bln
+25.201 bln
130.05%
jan 1, 2009
50.716 bln
+6.137 bln
13.77%
jan 1, 2010
31.481 bln
-19.235 bln
-37.93%
jan 1, 2011
88.452 bln
+56.971 bln
180.97%
jan 1, 2012
101.158 bln
+12.706 bln
14.36%
jan 1, 2013
86.607 bln
-14.551 bln
-14.38%
jan 1, 2014
69.181 bln
-17.425 bln
-20.12%
jan 1, 2015
96.895 bln
+27.714 bln
40.06%
jan 1, 2016
75.075 bln
-21.82 bln
-22.52%
Ranking of countries by current statistics by years


Comments: