29
/
en
AIzaSyAYiBZKx7MnpbEhh9jyipgxe19OcubqV5w
April 1, 2024
254794
Suriname
SUR
true
2
1
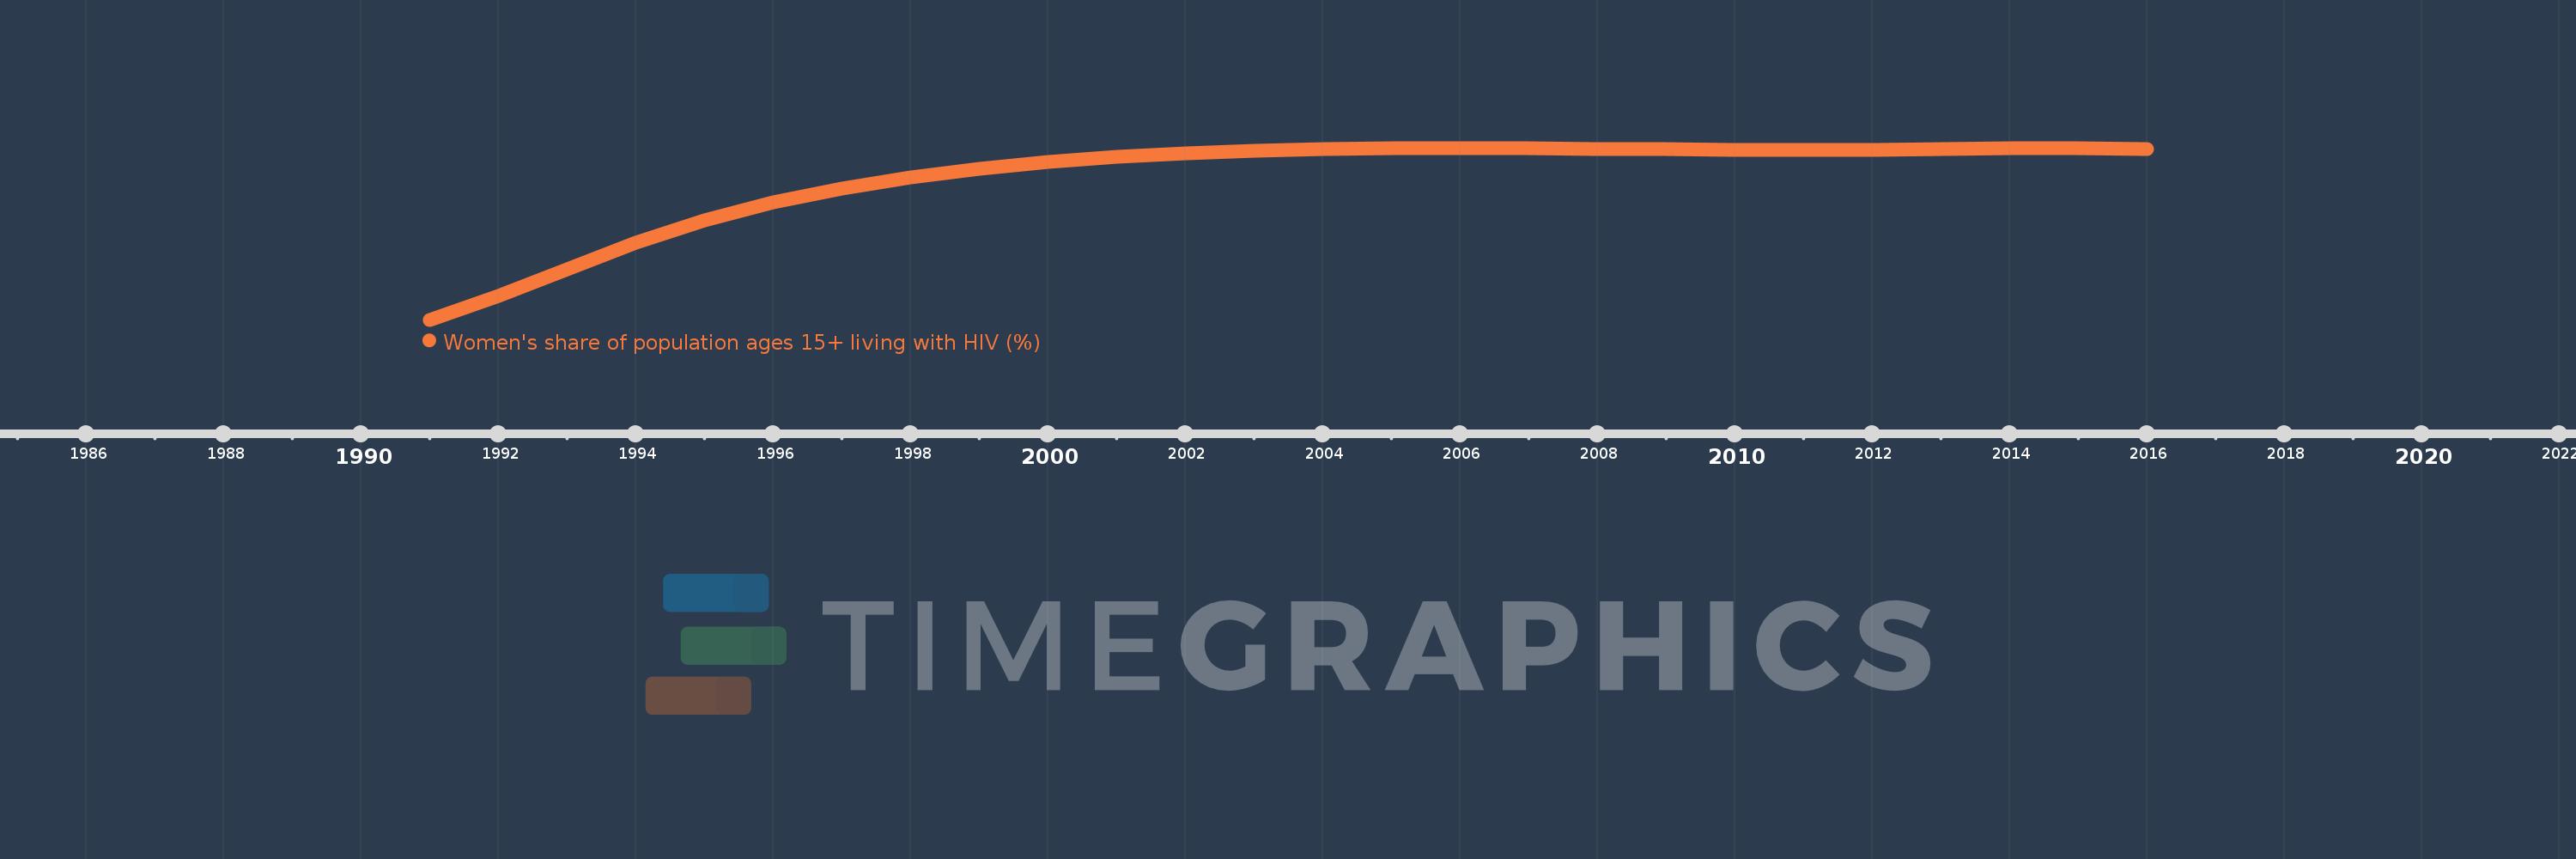
Women's share of population ages 15+ living with HIV (%)
2016,2015,2014,2013,2012,2011,2010,2009,2008,2007,2006,2005,2004,2003,2002,2001,2000,1999,1998,1997,1996,1995,1994,1993,1992,1991
This statistics in other country:
Timeline:
This timeline shows a graph from 1991 to 2016 of Suriname. No data until 1990. Number of actual observations by date: 26.
Source name:
World Development Indicators
Source organization:
UNAIDS estimates.
Categories, topics:
Health, Gender
Last updated:
apr 23, 2017
Indicators value changes by year
Minimum:
16.511
jan 1, 1991
Maximum:
47.435
jan 1, 2006
At the date of observation
Value
Absolute change
Change from previous value
jan 1, 1991
16.511
+16.511
0.0%
jan 1, 1992
20.776
+4.265
25.83%
jan 1, 1993
25.601
+4.825
23.22%
jan 1, 1994
30.327
+4.725
18.46%
jan 1, 1995
34.366
+4.039
13.32%
jan 1, 1996
37.618
+3.253
9.46%
jan 1, 1997
40.064
+2.446
6.5%
jan 1, 1998
42.166
+2.102
5.25%
jan 1, 1999
43.747
+1.581
3.75%
jan 1, 2000
44.917
+1.17
2.67%
jan 1, 2001
45.801
+0.884
1.97%
jan 1, 2002
46.452
+0.65
1.42%
jan 1, 2003
46.92
+0.469
1.01%
jan 1, 2004
47.262
+0.342
0.73%
jan 1, 2005
47.403
+0.141
0.3%
jan 1, 2006
47.435
+0.032
0.07%
jan 1, 2007
47.344
-0.091
-0.19%
jan 1, 2008
47.275
-0.069
-0.15%
jan 1, 2009
47.199
-0.076
-0.16%
jan 1, 2010
47.113
-0.085
-0.18%
jan 1, 2011
47.017
-0.096
-0.2%
jan 1, 2012
47.041
+0.024
0.05%
jan 1, 2013
47.227
+0.185
0.39%
jan 1, 2014
47.376
+0.149
0.32%
jan 1, 2015
47.358
-0.017
-0.04%
jan 1, 2016
47.295
-0.063
-0.13%
Ranking of countries by current statistics by years


Comments: