29
/
en
AIzaSyAYiBZKx7MnpbEhh9jyipgxe19OcubqV5w
April 1, 2024
236652
Senegal
SEN
true
2
1
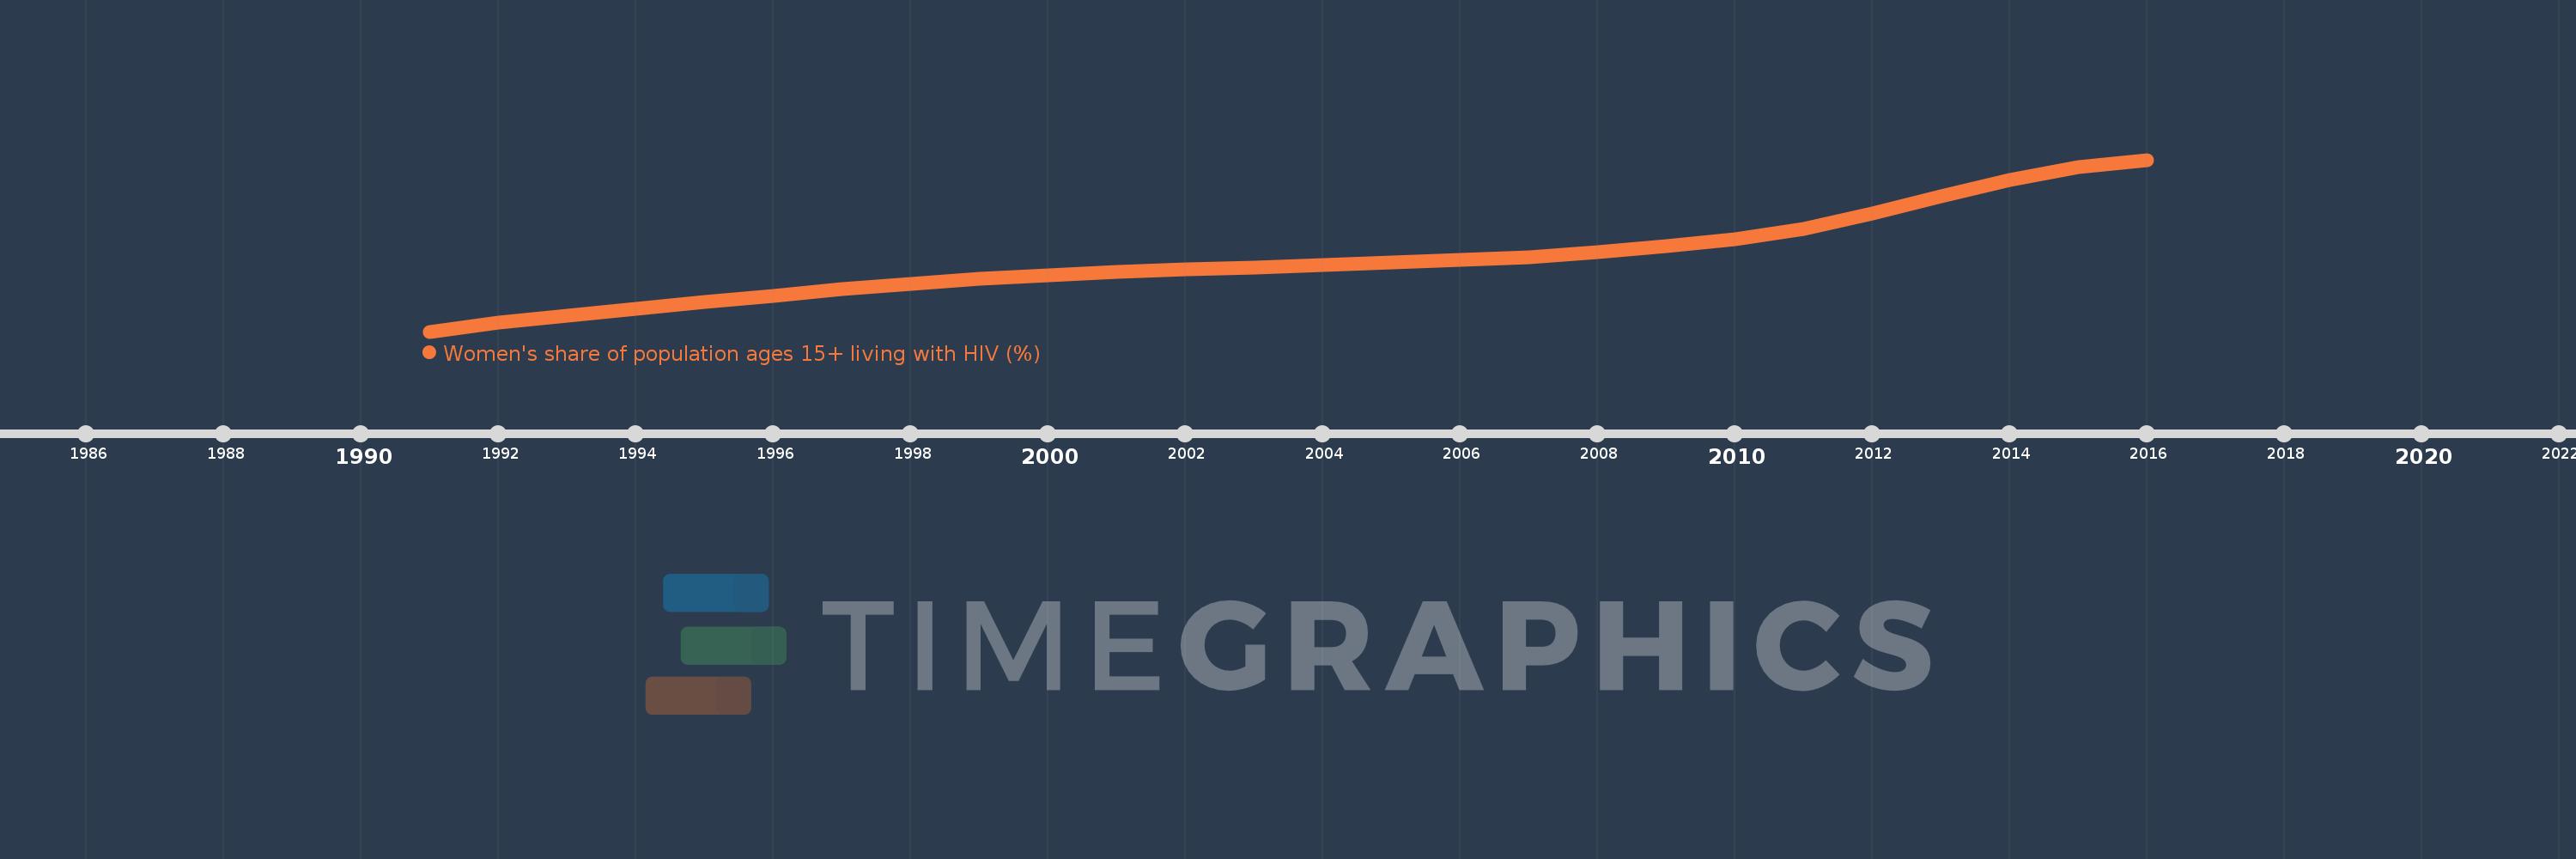
Women's share of population ages 15+ living with HIV (%)
2016,2015,2014,2013,2012,2011,2010,2009,2008,2007,2006,2005,2004,2003,2002,2001,2000,1999,1998,1997,1996,1995,1994,1993,1992,1991
This statistics in other country:
Timeline:
This timeline shows a graph from 1991 to 2016 of Senegal. No data until 1990. Number of actual observations by date: 26.
Source name:
World Development Indicators
Source organization:
UNAIDS estimates.
Categories, topics:
Health, Gender
Last updated:
apr 23, 2017
Indicators value changes by year
Minimum:
53.062
jan 1, 1991
Maximum:
63.554
jan 1, 2016
At the date of observation
Value
Absolute change
Change from previous value
jan 1, 1991
53.062
+53.062
0.0%
jan 1, 1992
53.588
+0.526
0.99%
jan 1, 1993
54.039
+0.451
0.84%
jan 1, 1994
54.46
+0.421
0.78%
jan 1, 1995
54.848
+0.388
0.71%
jan 1, 1996
55.244
+0.395
0.72%
jan 1, 1997
55.633
+0.389
0.7%
jan 1, 1998
55.981
+0.349
0.63%
jan 1, 1999
56.272
+0.291
0.52%
jan 1, 2000
56.519
+0.246
0.44%
jan 1, 2001
56.699
+0.18
0.32%
jan 1, 2002
56.852
+0.153
0.27%
jan 1, 2003
56.989
+0.137
0.24%
jan 1, 2004
57.123
+0.134
0.24%
jan 1, 2005
57.264
+0.141
0.25%
jan 1, 2006
57.432
+0.168
0.29%
jan 1, 2007
57.61
+0.178
0.31%
jan 1, 2008
57.891
+0.281
0.49%
jan 1, 2009
58.272
+0.381
0.66%
jan 1, 2010
58.678
+0.406
0.7%
jan 1, 2011
59.339
+0.661
1.13%
jan 1, 2012
60.291
+0.952
1.6%
jan 1, 2013
61.322
+1.03
1.71%
jan 1, 2014
62.33
+1.008
1.64%
jan 1, 2015
63.092
+0.763
1.22%
jan 1, 2016
63.554
+0.461
0.73%
Ranking of countries by current statistics by years


Comments: