29
/
en
AIzaSyAYiBZKx7MnpbEhh9jyipgxe19OcubqV5w
April 1, 2024
253809
Sudan
SDN
true
2
1
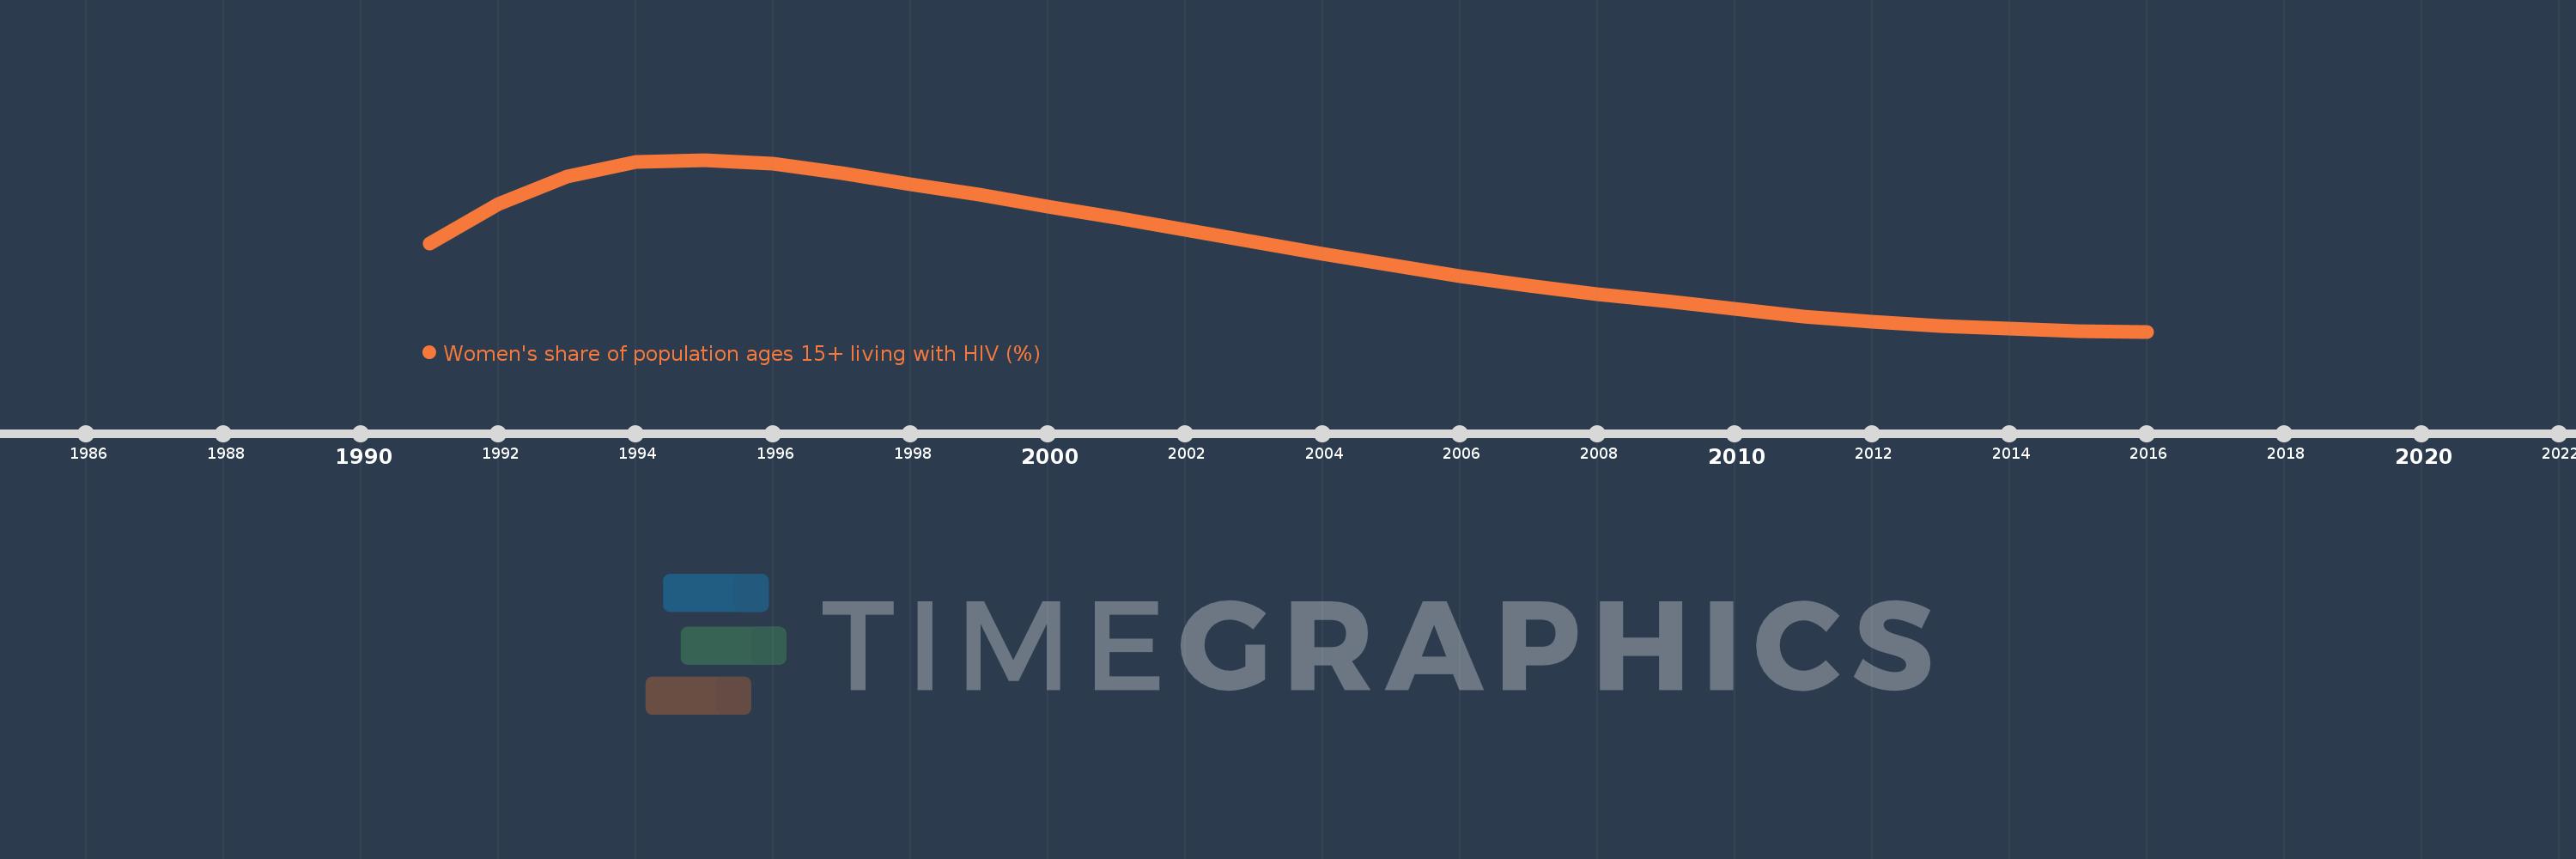
Women's share of population ages 15+ living with HIV (%)
2016,2015,2014,2013,2012,2011,2010,2009,2008,2007,2006,2005,2004,2003,2002,2001,2000,1999,1998,1997,1996,1995,1994,1993,1992,1991
This statistics in other country:
Timeline:
This timeline shows a graph from 1991 to 2016 of Sudan. No data until 1990. Number of actual observations by date: 26.
Source name:
World Development Indicators
Source organization:
UNAIDS estimates.
Categories, topics:
Health, Gender
Last updated:
apr 23, 2017
Indicators value changes by year
Minimum:
46.904
jan 1, 2016
Maximum:
54.847
jan 1, 1995
At the date of observation
Value
Absolute change
Change from previous value
jan 1, 1991
50.956
+50.956
0.0%
jan 1, 1992
52.79
+1.834
3.6%
jan 1, 1993
54.065
+1.275
2.42%
jan 1, 1994
54.747
+0.681
1.26%
jan 1, 1995
54.847
+0.1
0.18%
jan 1, 1996
54.668
-0.178
-0.33%
jan 1, 1997
54.231
-0.437
-0.8%
jan 1, 1998
53.728
-0.503
-0.93%
jan 1, 1999
53.243
-0.486
-0.9%
jan 1, 2000
52.685
-0.558
-1.05%
jan 1, 2001
52.15
-0.535
-1.01%
jan 1, 2002
51.62
-0.531
-1.02%
jan 1, 2003
51.046
-0.573
-1.11%
jan 1, 2004
50.489
-0.558
-1.09%
jan 1, 2005
49.963
-0.526
-1.04%
jan 1, 2006
49.446
-0.517
-1.03%
jan 1, 2007
49.021
-0.425
-0.86%
jan 1, 2008
48.642
-0.379
-0.77%
jan 1, 2009
48.297
-0.345
-0.71%
jan 1, 2010
47.949
-0.348
-0.72%
jan 1, 2011
47.611
-0.338
-0.71%
jan 1, 2012
47.367
-0.244
-0.51%
jan 1, 2013
47.161
-0.206
-0.43%
jan 1, 2014
47.031
-0.131
-0.28%
jan 1, 2015
46.935
-0.096
-0.2%
jan 1, 2016
46.904
-0.031
-0.07%
Ranking of countries by current statistics by years


Comments: