29
/
en
AIzaSyAYiBZKx7MnpbEhh9jyipgxe19OcubqV5w
April 1, 2024
127087
El Salvador
SLV
true
2
1
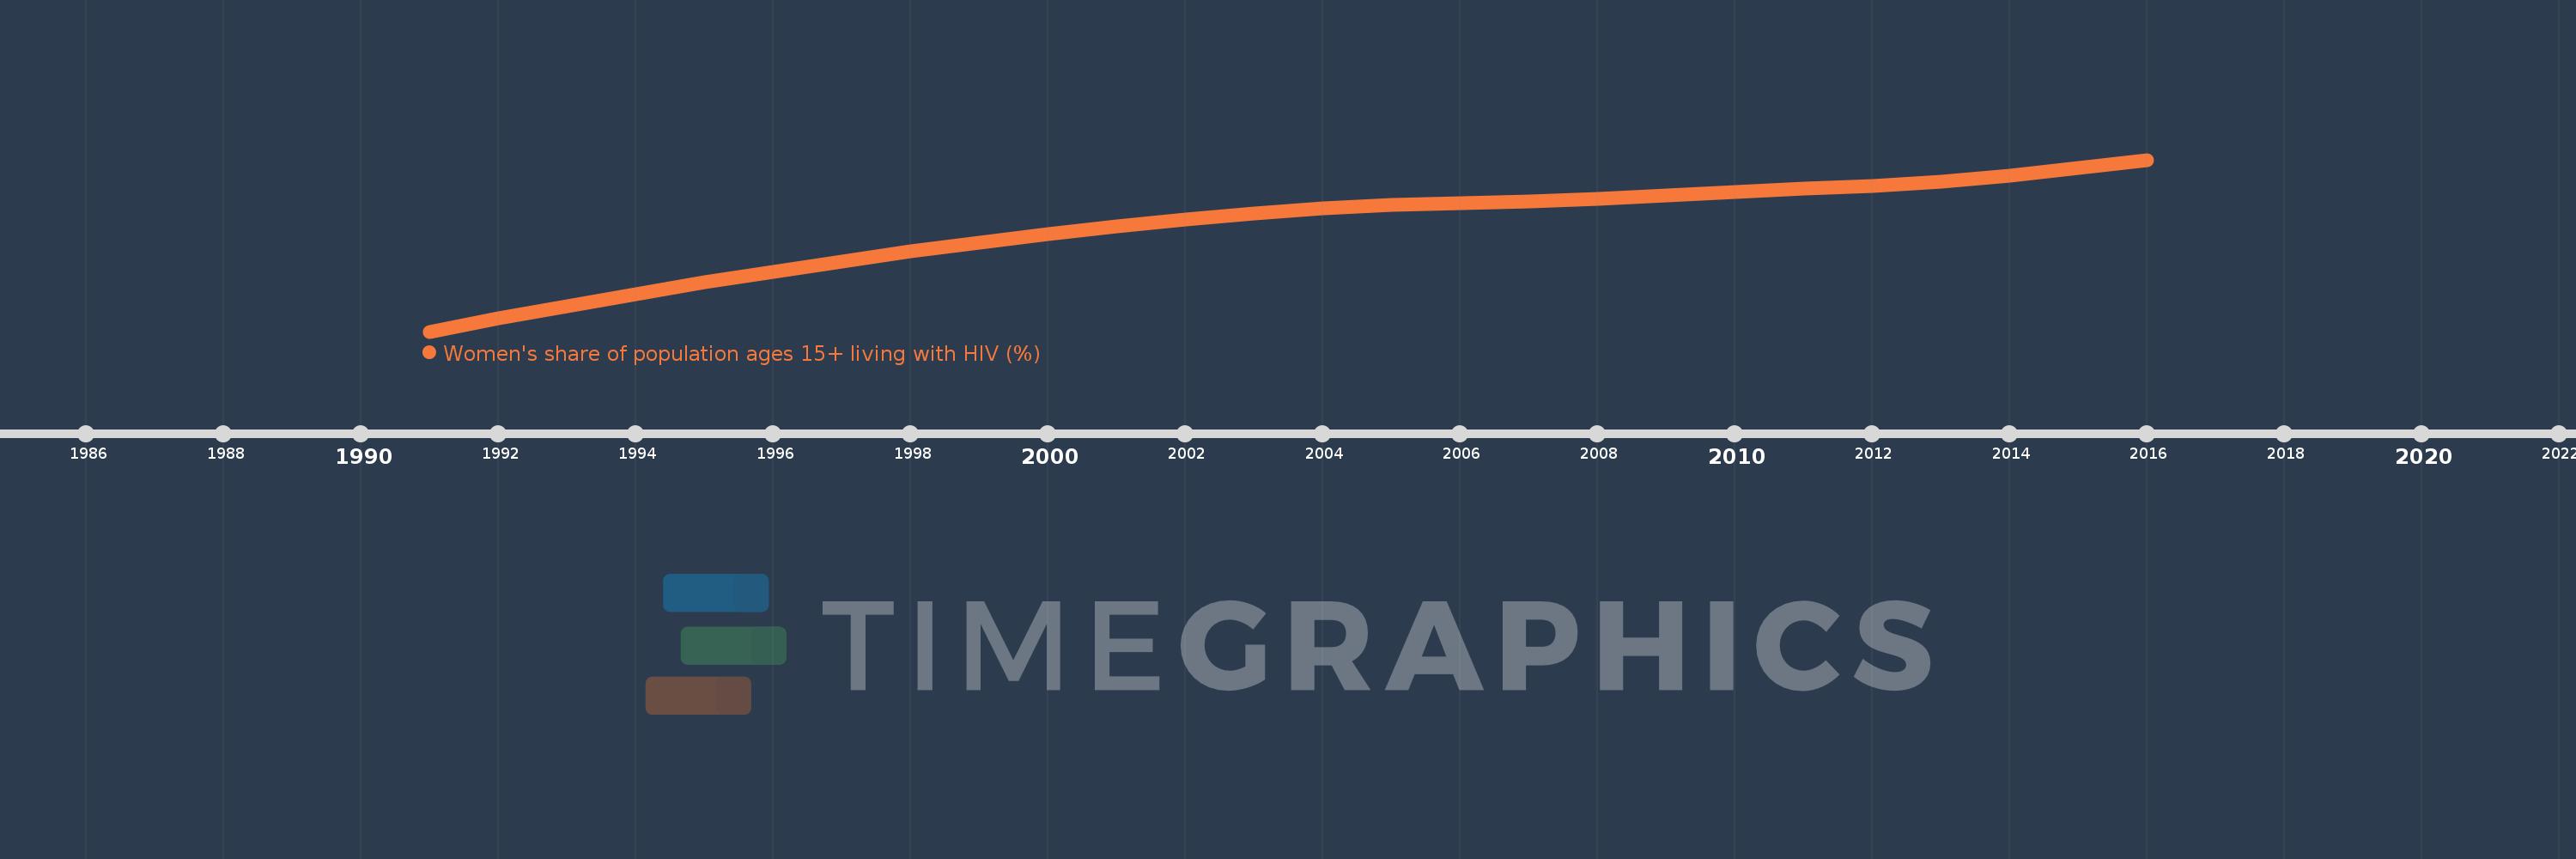
Women's share of population ages 15+ living with HIV (%)
2016,2015,2014,2013,2012,2011,2010,2009,2008,2007,2006,2005,2004,2003,2002,2001,2000,1999,1998,1997,1996,1995,1994,1993,1992,1991
This statistics in other country:
Timeline:
This timeline shows a graph from 1991 to 2016 of El Salvador. No data until 1990. Number of actual observations by date: 26.
Source name:
World Development Indicators
Source organization:
UNAIDS estimates.
Categories, topics:
Health, Gender
Last updated:
apr 23, 2017
Indicators value changes by year
Minimum:
26.123
jan 1, 1991
Maximum:
35.323
jan 1, 2016
At the date of observation
Value
Absolute change
Change from previous value
jan 1, 1991
26.123
+26.123
0.0%
jan 1, 1992
26.83
+0.707
2.71%
jan 1, 1993
27.496
+0.666
2.48%
jan 1, 1994
28.142
+0.646
2.35%
jan 1, 1995
28.751
+0.61
2.17%
jan 1, 1996
29.34
+0.588
2.05%
jan 1, 1997
29.886
+0.547
1.86%
jan 1, 1998
30.403
+0.516
1.73%
jan 1, 1999
30.878
+0.475
1.56%
jan 1, 2000
31.329
+0.451
1.46%
jan 1, 2001
31.743
+0.414
1.32%
jan 1, 2002
32.122
+0.379
1.19%
jan 1, 2003
32.457
+0.335
1.04%
jan 1, 2004
32.72
+0.263
0.81%
jan 1, 2005
32.899
+0.179
0.55%
jan 1, 2006
33.0
+0.1
0.31%
jan 1, 2007
33.092
+0.092
0.28%
jan 1, 2008
33.239
+0.148
0.45%
jan 1, 2009
33.405
+0.165
0.5%
jan 1, 2010
33.579
+0.174
0.52%
jan 1, 2011
33.76
+0.182
0.54%
jan 1, 2012
33.942
+0.181
0.54%
jan 1, 2013
34.154
+0.213
0.63%
jan 1, 2014
34.483
+0.329
0.96%
jan 1, 2015
34.887
+0.403
1.17%
jan 1, 2016
35.323
+0.437
1.25%
Ranking of countries by current statistics by years


Comments: