29
/
en
AIzaSyAYiBZKx7MnpbEhh9jyipgxe19OcubqV5w
April 1, 2024
188646
Malaysia
MYS
true
2
1
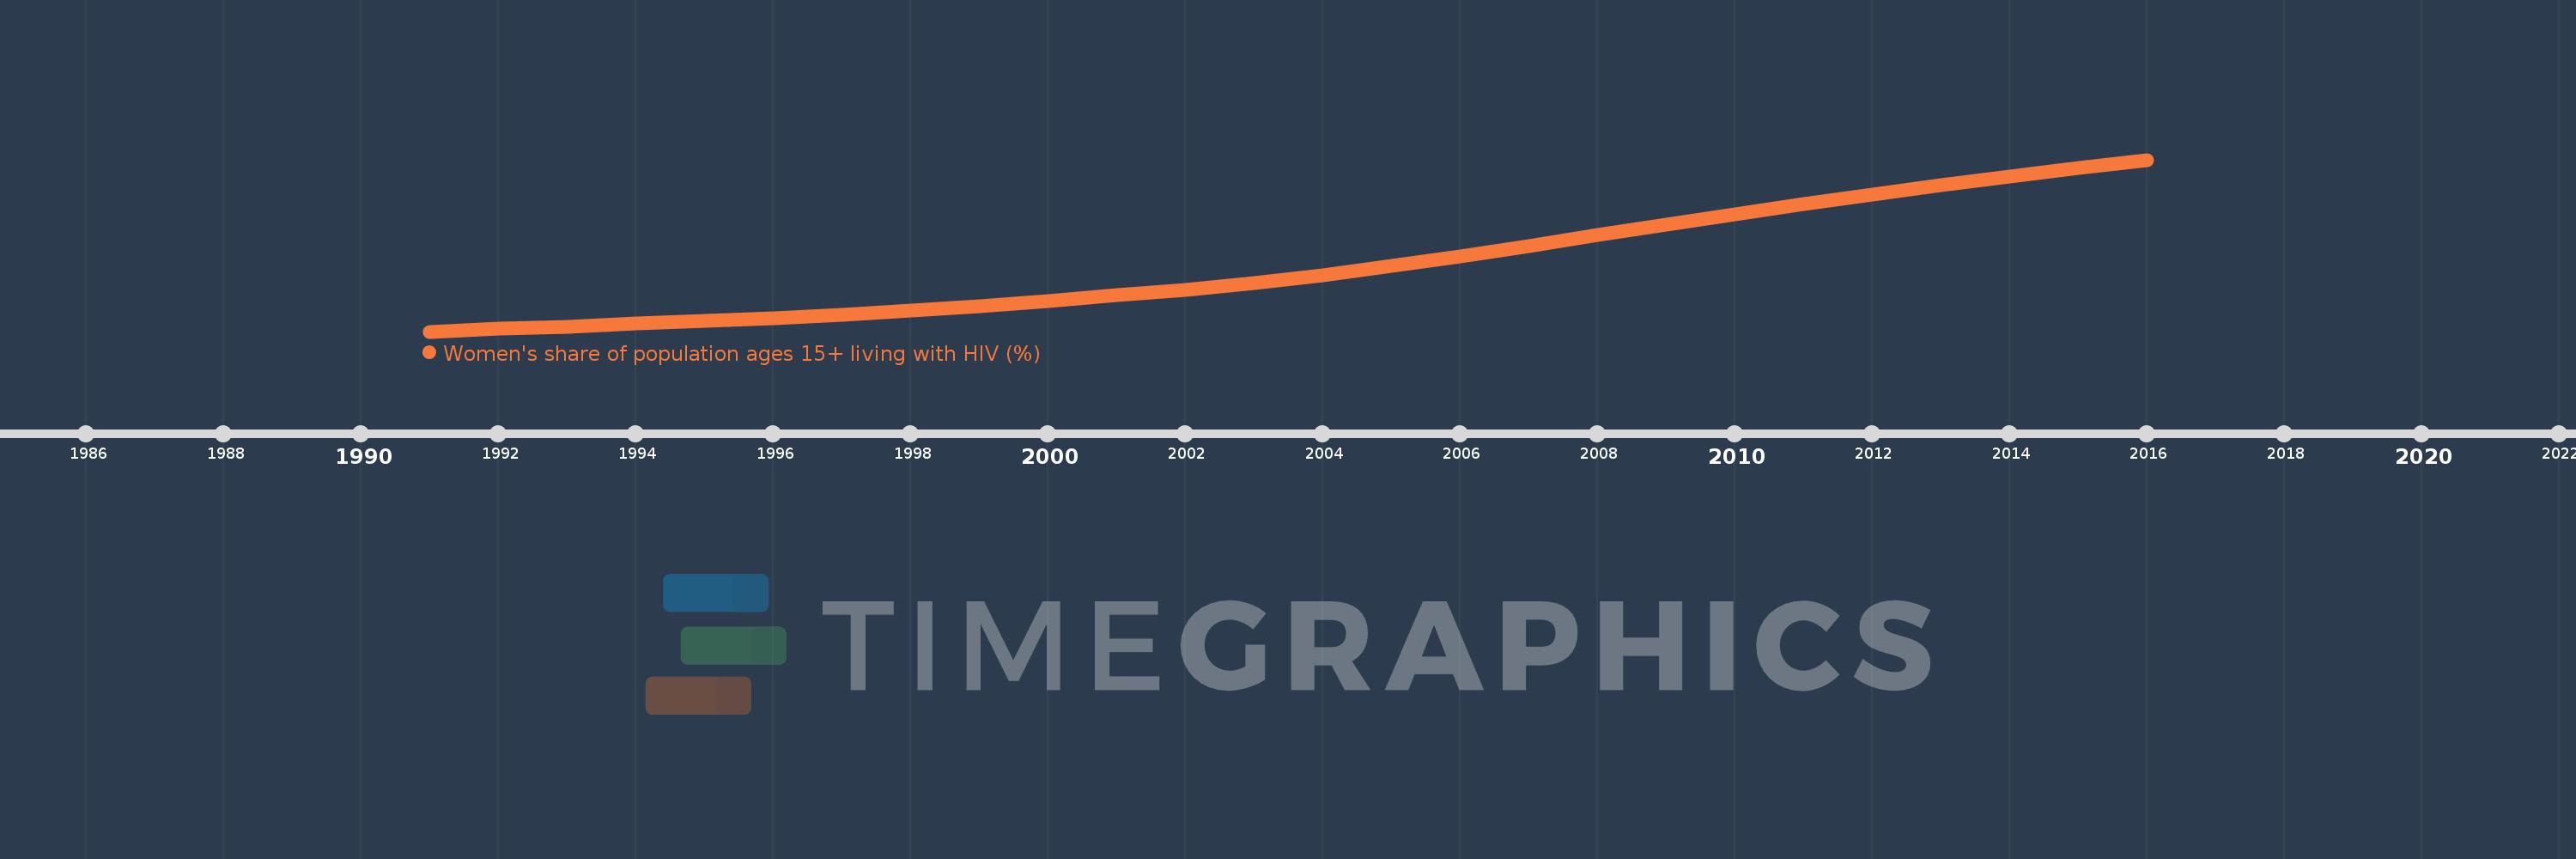
Women's share of population ages 15+ living with HIV (%)
2016,2015,2014,2013,2012,2011,2010,2009,2008,2007,2006,2005,2004,2003,2002,2001,2000,1999,1998,1997,1996,1995,1994,1993,1992,1991
This statistics in other country:
Timeline:
This timeline shows a graph from 1991 to 2016 of Malaysia. No data until 1990. Number of actual observations by date: 26.
Source name:
World Development Indicators
Source organization:
UNAIDS estimates.
Categories, topics:
Health, Gender
Last updated:
apr 23, 2017
Indicators value changes by year
Maximum:
13.926
jan 1, 2016
At the date of observation
Value
Absolute change
Change from previous value
jan 1, 1991
0.936
+0.936
0.0%
jan 1, 1992
1.174
+0.238
25.37%
jan 1, 1993
1.318
+0.144
12.29%
jan 1, 1994
1.545
+0.227
17.2%
jan 1, 1995
1.723
+0.178
11.52%
jan 1, 1996
1.954
+0.231
13.4%
jan 1, 1997
2.202
+0.248
12.7%
jan 1, 1998
2.514
+0.313
14.2%
jan 1, 1999
2.86
+0.345
13.73%
jan 1, 2000
3.25
+0.391
13.67%
jan 1, 2001
3.674
+0.423
13.02%
jan 1, 2002
4.114
+0.44
11.98%
jan 1, 2003
4.612
+0.498
12.11%
jan 1, 2004
5.221
+0.609
13.21%
jan 1, 2005
5.897
+0.675
12.94%
jan 1, 2006
6.62
+0.723
12.26%
jan 1, 2007
7.399
+0.779
11.77%
jan 1, 2008
8.216
+0.817
11.05%
jan 1, 2009
9.018
+0.801
9.75%
jan 1, 2010
9.809
+0.792
8.78%
jan 1, 2011
10.576
+0.767
7.82%
jan 1, 2012
11.311
+0.735
6.95%
jan 1, 2013
12.012
+0.7
6.19%
jan 1, 2014
12.657
+0.646
5.38%
jan 1, 2015
13.277
+0.619
4.89%
jan 1, 2016
13.926
+0.649
4.89%
Ranking of countries by current statistics by years


Comments: