29
/
en
AIzaSyAYiBZKx7MnpbEhh9jyipgxe19OcubqV5w
April 1, 2024
246473
South Africa
ZAF
true
2
1
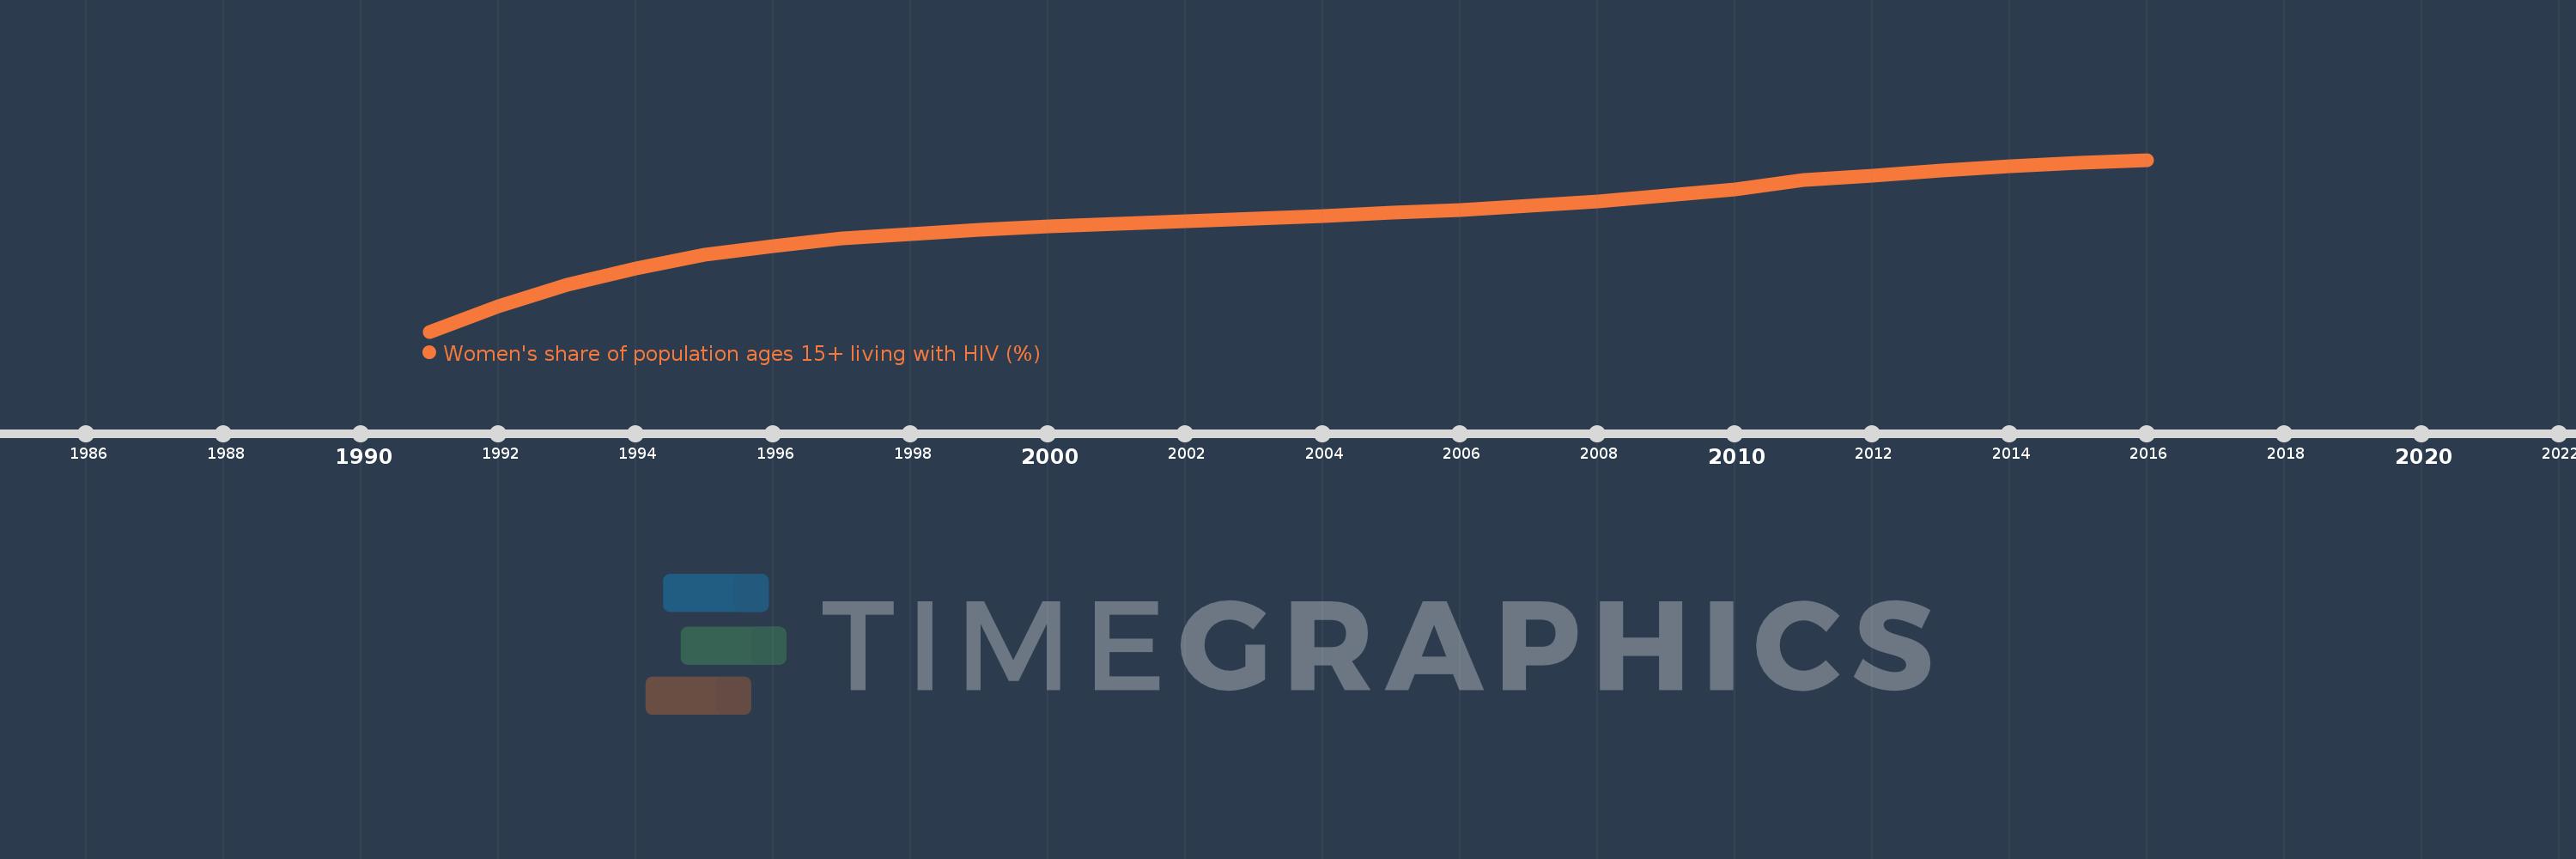
Women's share of population ages 15+ living with HIV (%)
2016,2015,2014,2013,2012,2011,2010,2009,2008,2007,2006,2005,2004,2003,2002,2001,2000,1999,1998,1997,1996,1995,1994,1993,1992,1991
This statistics in other country:
Timeline:
This timeline shows a graph from 1991 to 2016 of South Africa. No data until 1990. Number of actual observations by date: 26.
Source name:
World Development Indicators
Source organization:
UNAIDS estimates.
Categories, topics:
Health, Gender
Last updated:
apr 23, 2017
Indicators value changes by year
Minimum:
51.975
jan 1, 1991
Maximum:
59.675
jan 1, 2016
At the date of observation
Value
Absolute change
Change from previous value
jan 1, 1991
51.975
+51.975
0.0%
jan 1, 1992
53.13
+1.155
2.22%
jan 1, 1993
54.082
+0.952
1.79%
jan 1, 1994
54.815
+0.733
1.36%
jan 1, 1995
55.408
+0.593
1.08%
jan 1, 1996
55.807
+0.399
0.72%
jan 1, 1997
56.151
+0.344
0.62%
jan 1, 1998
56.358
+0.207
0.37%
jan 1, 1999
56.555
+0.196
0.35%
jan 1, 2000
56.698
+0.143
0.25%
jan 1, 2001
56.82
+0.122
0.22%
jan 1, 2002
56.933
+0.112
0.2%
jan 1, 2003
57.046
+0.114
0.2%
jan 1, 2004
57.165
+0.119
0.21%
jan 1, 2005
57.293
+0.128
0.22%
jan 1, 2006
57.432
+0.139
0.24%
jan 1, 2007
57.608
+0.176
0.31%
jan 1, 2008
57.818
+0.209
0.36%
jan 1, 2009
58.069
+0.251
0.43%
jan 1, 2010
58.357
+0.288
0.5%
jan 1, 2011
58.766
+0.408
0.7%
jan 1, 2012
58.964
+0.198
0.34%
jan 1, 2013
59.18
+0.216
0.37%
jan 1, 2014
59.385
+0.205
0.35%
jan 1, 2015
59.543
+0.158
0.27%
jan 1, 2016
59.675
+0.132
0.22%
Ranking of countries by current statistics by years


Comments: