29
/
en
AIzaSyAYiBZKx7MnpbEhh9jyipgxe19OcubqV5w
April 1, 2024
283154
Vietnam
VNM
true
2
1
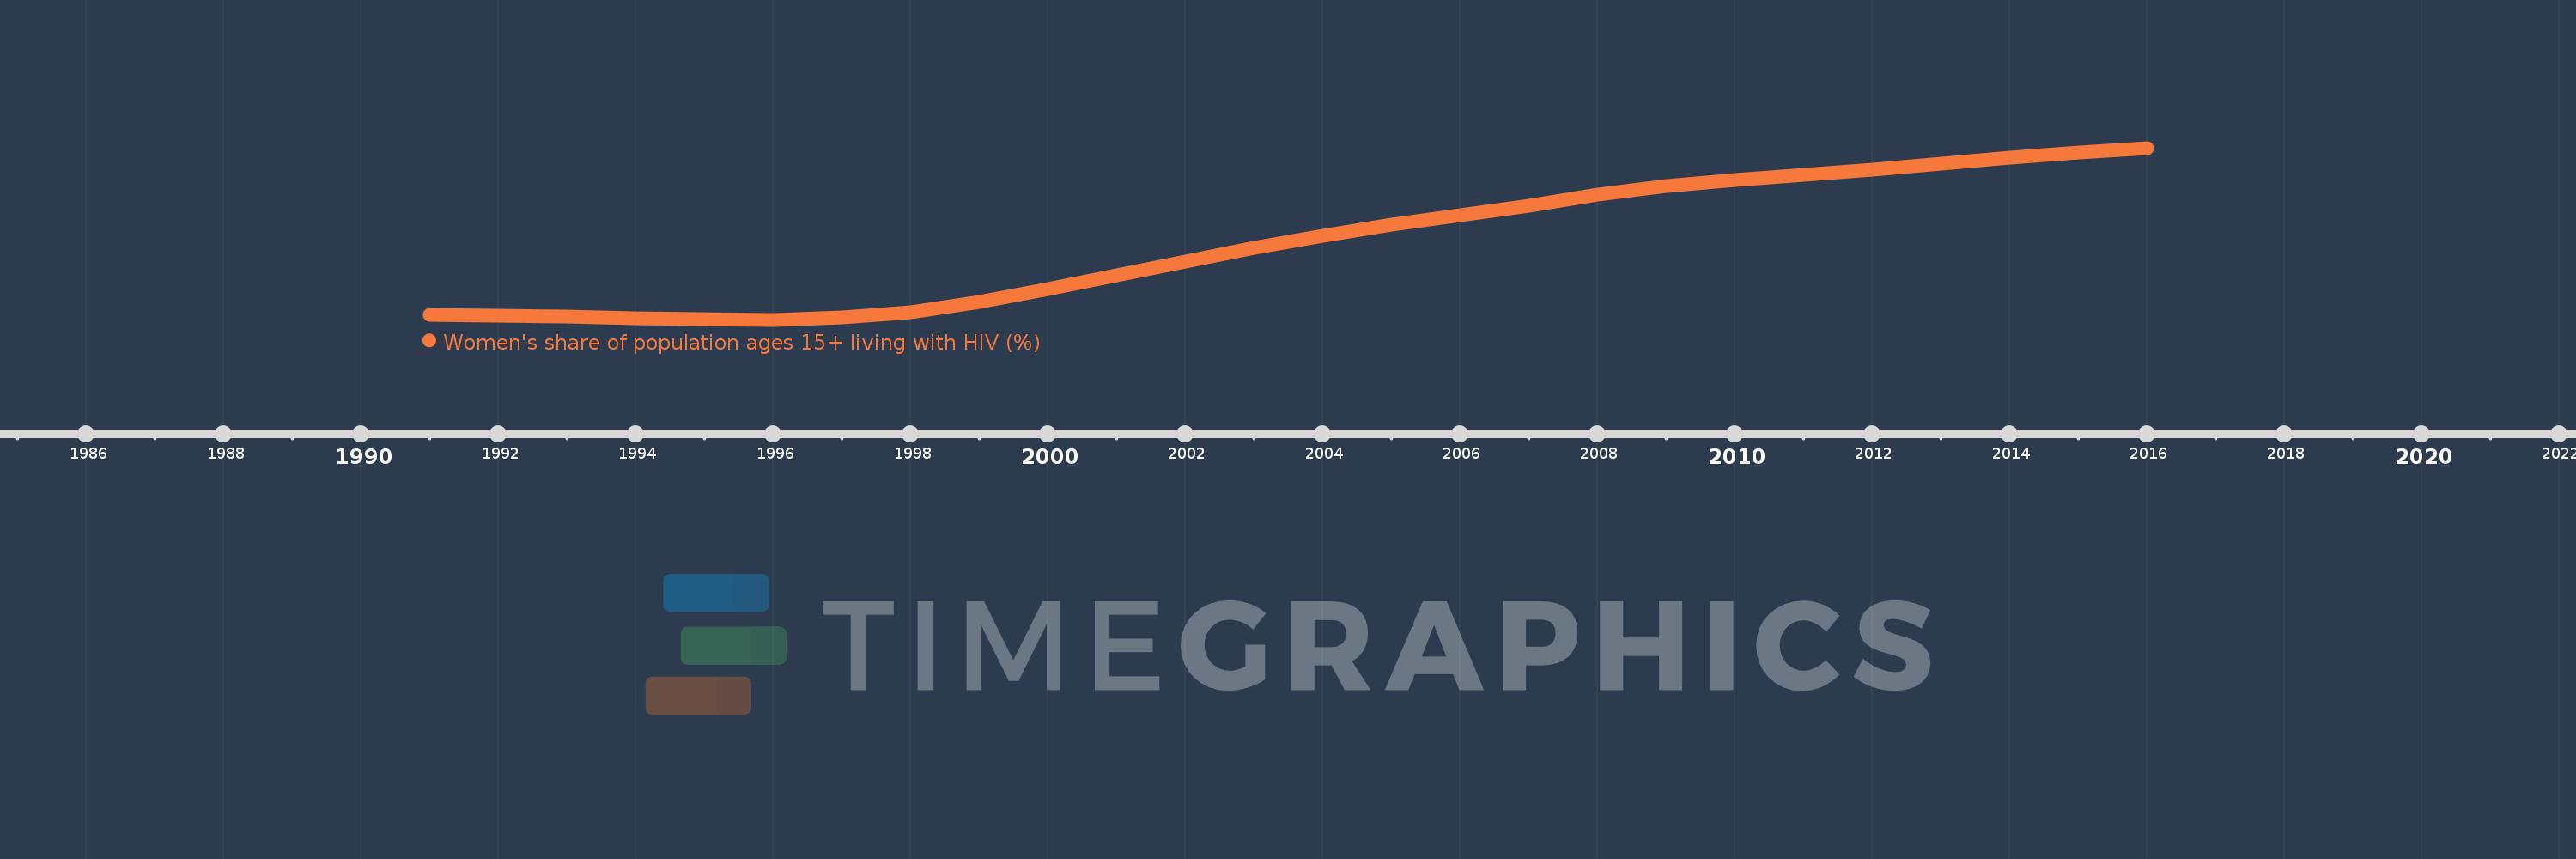
Women's share of population ages 15+ living with HIV (%)
2016,2015,2014,2013,2012,2011,2010,2009,2008,2007,2006,2005,2004,2003,2002,2001,2000,1999,1998,1997,1996,1995,1994,1993,1992,1991
This statistics in other country:
Timeline:
This timeline shows a graph from 1991 to 2016 of Vietnam. No data until 1990. Number of actual observations by date: 26.
Source name:
World Development Indicators
Source organization:
UNAIDS estimates.
Categories, topics:
Health, Gender
Last updated:
apr 23, 2017
Indicators value changes by year
Maximum:
30.592
jan 1, 2016
At the date of observation
Value
Absolute change
Change from previous value
jan 1, 1991
10.323
+10.323
0.0%
jan 1, 1992
10.294
-0.028
-0.28%
jan 1, 1993
10.185
-0.11
-1.06%
jan 1, 1994
9.968
-0.217
-2.13%
jan 1, 1995
9.823
-0.144
-1.45%
jan 1, 1996
9.777
-0.046
-0.47%
jan 1, 1997
10.029
+0.252
2.57%
jan 1, 1998
10.731
+0.703
7.01%
jan 1, 1999
11.911
+1.18
11.0%
jan 1, 2000
13.457
+1.546
12.98%
jan 1, 2001
15.145
+1.688
12.55%
jan 1, 2002
16.79
+1.644
10.86%
jan 1, 2003
18.503
+1.714
10.21%
jan 1, 2004
19.986
+1.483
8.01%
jan 1, 2005
21.3
+1.314
6.58%
jan 1, 2006
22.478
+1.178
5.53%
jan 1, 2007
23.623
+1.145
5.09%
jan 1, 2008
24.9
+1.277
5.41%
jan 1, 2009
25.968
+1.068
4.29%
jan 1, 2010
26.743
+0.775
2.99%
jan 1, 2011
27.375
+0.632
2.36%
jan 1, 2012
28.003
+0.628
2.29%
jan 1, 2013
28.641
+0.638
2.28%
jan 1, 2014
29.367
+0.726
2.54%
jan 1, 2015
29.999
+0.632
2.15%
jan 1, 2016
30.592
+0.593
1.98%
Ranking of countries by current statistics by years


Comments: