29
/
en
AIzaSyAYiBZKx7MnpbEhh9jyipgxe19OcubqV5w
April 1, 2024
155508
India
IND
true
2
1
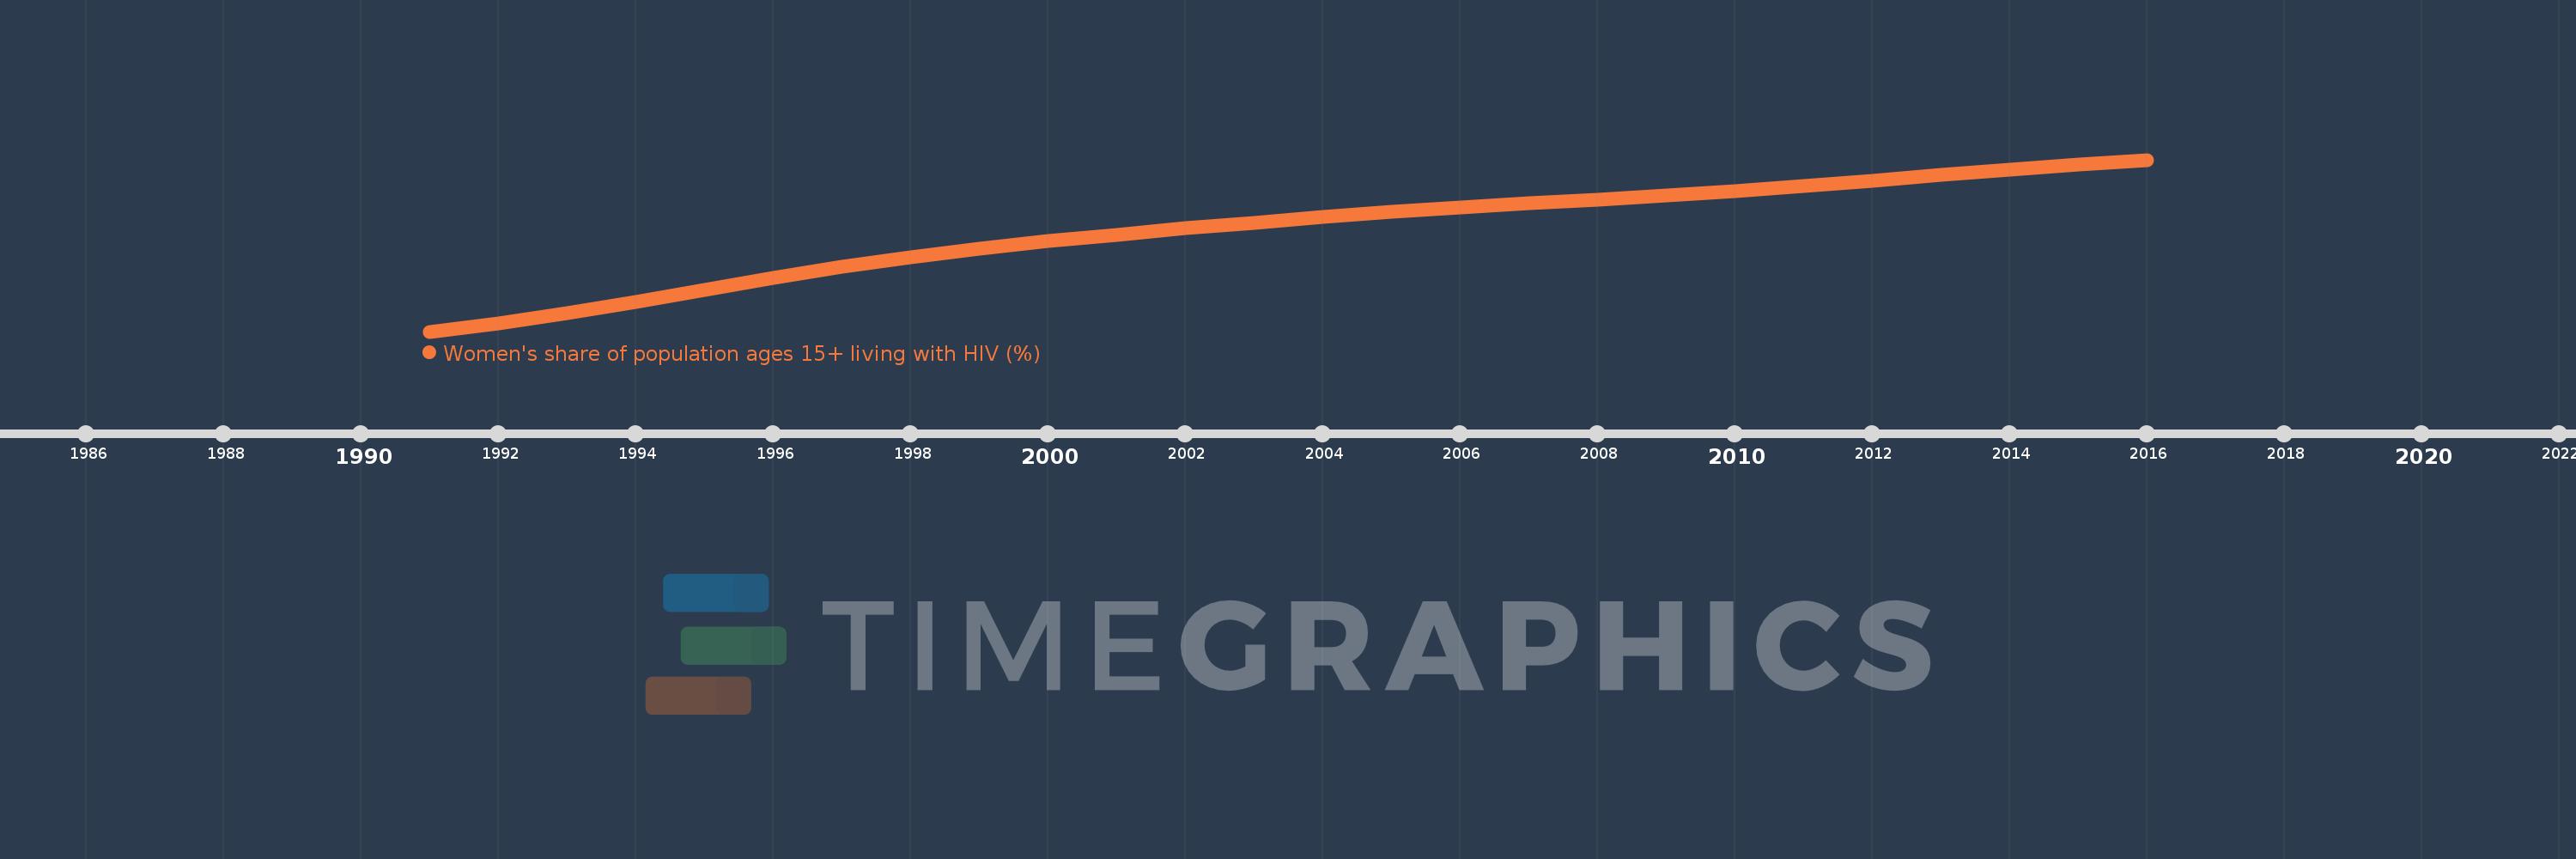
Women's share of population ages 15+ living with HIV (%)
2016,2015,2014,2013,2012,2011,2010,2009,2008,2007,2006,2005,2004,2003,2002,2001,2000,1999,1998,1997,1996,1995,1994,1993,1992,1991
This statistics in other country:
Timeline:
This timeline shows a graph from 1991 to 2016 of India. No data until 1990. Number of actual observations by date: 26.
Source name:
World Development Indicators
Source organization:
UNAIDS estimates.
Categories, topics:
Health, Gender
Last updated:
apr 23, 2017
Indicators value changes by year
Minimum:
27.487
jan 1, 1991
At the date of observation
Value
Absolute change
Change from previous value
jan 1, 1991
27.487
+27.487
0.0%
jan 1, 1992
28.113
+0.626
2.28%
jan 1, 1993
28.827
+0.714
2.54%
jan 1, 1994
29.643
+0.816
2.83%
jan 1, 1995
30.553
+0.911
3.07%
jan 1, 1996
31.464
+0.91
2.98%
jan 1, 1997
32.253
+0.79
2.51%
jan 1, 1998
32.921
+0.668
2.07%
jan 1, 1999
33.563
+0.642
1.95%
jan 1, 2000
34.123
+0.56
1.67%
jan 1, 2001
34.618
+0.495
1.45%
jan 1, 2002
35.071
+0.452
1.31%
jan 1, 2003
35.499
+0.429
1.22%
jan 1, 2004
35.904
+0.405
1.14%
jan 1, 2005
36.276
+0.371
1.03%
jan 1, 2006
36.616
+0.34
0.94%
jan 1, 2007
36.922
+0.306
0.84%
jan 1, 2008
37.206
+0.284
0.77%
jan 1, 2009
37.502
+0.297
0.8%
jan 1, 2010
37.824
+0.322
0.86%
jan 1, 2011
38.187
+0.363
0.96%
jan 1, 2012
38.594
+0.408
1.07%
jan 1, 2013
39.012
+0.418
1.08%
jan 1, 2014
39.413
+0.401
1.03%
jan 1, 2015
39.788
+0.375
0.95%
jan 1, 2016
40.12
+0.332
0.83%
Ranking of countries by current statistics by years


Comments: