29
/
en
AIzaSyAYiBZKx7MnpbEhh9jyipgxe19OcubqV5w
April 1, 2024
212526
Niger
NER
true
2
1
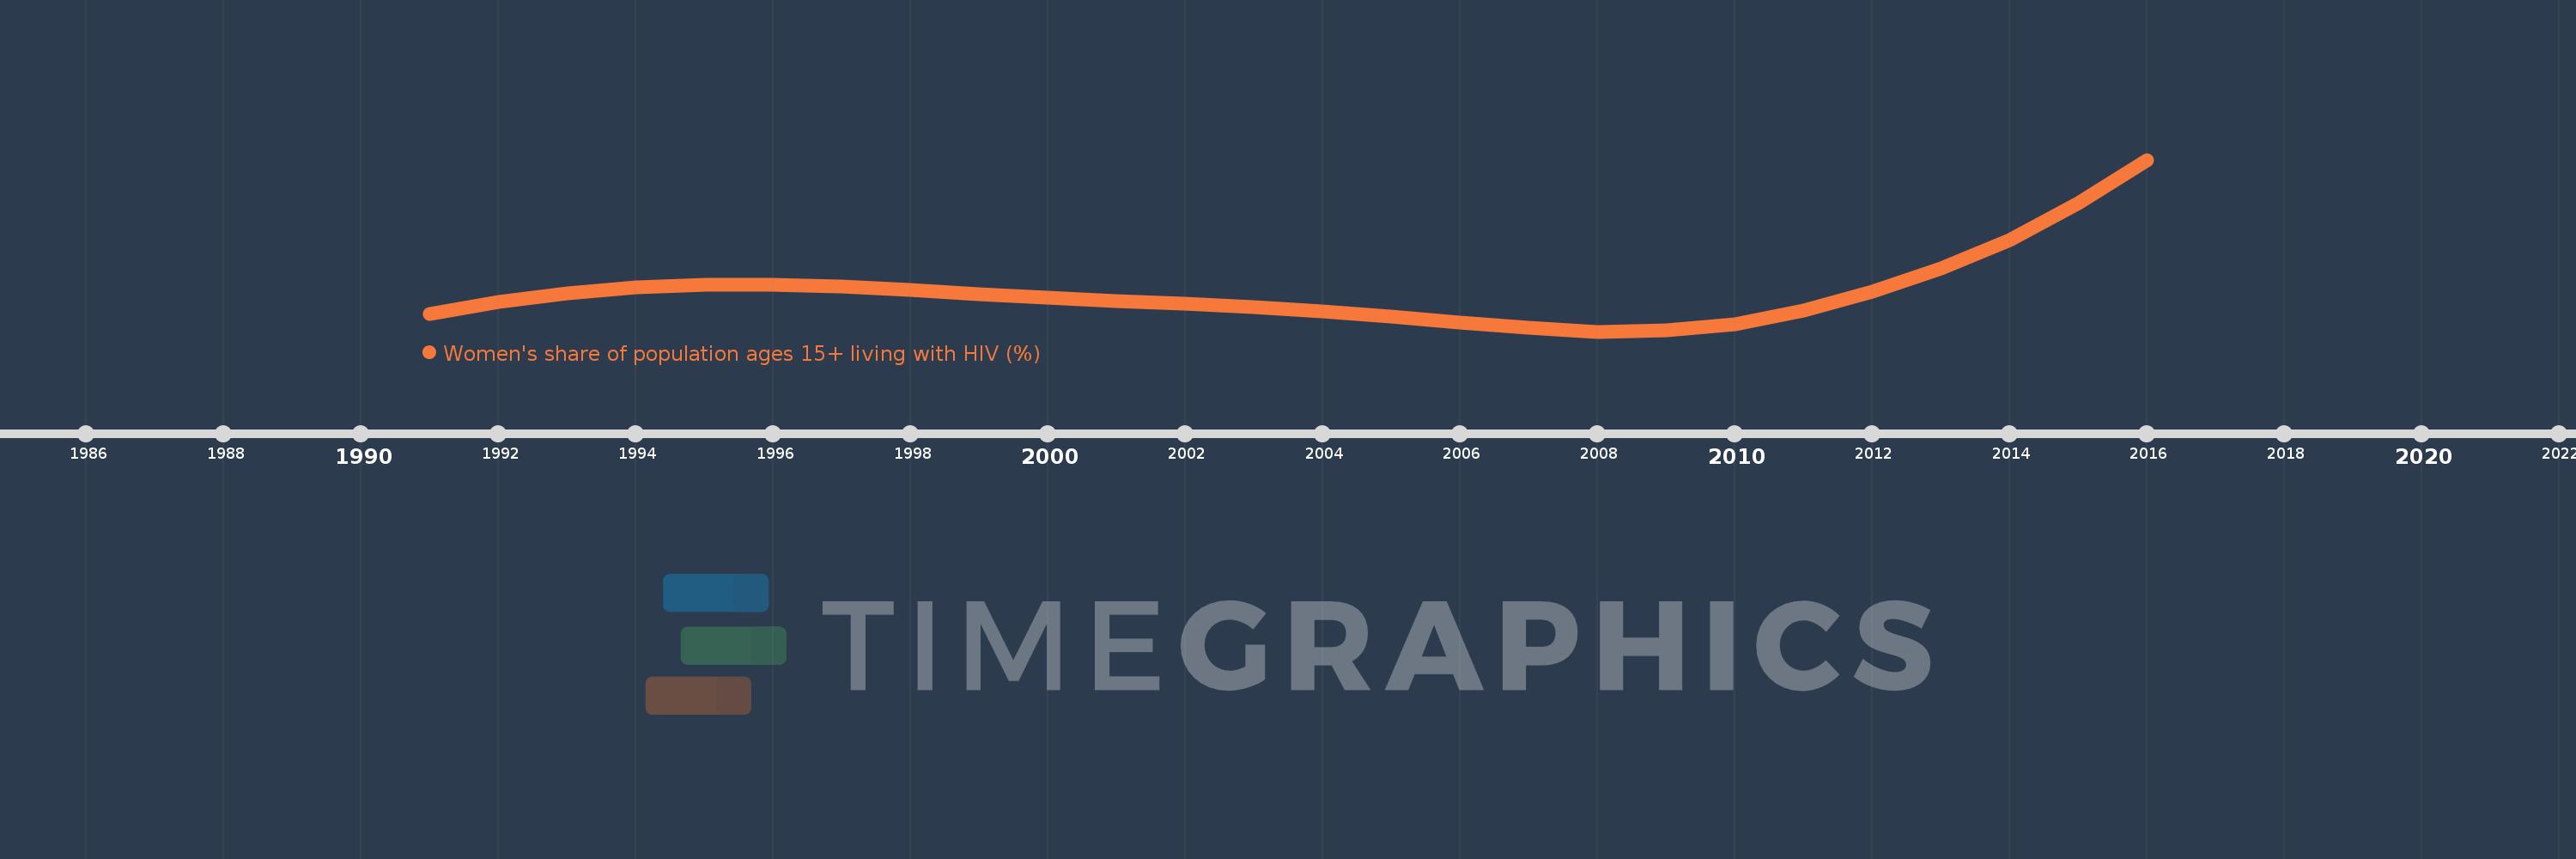
Women's share of population ages 15+ living with HIV (%)
2016,2015,2014,2013,2012,2011,2010,2009,2008,2007,2006,2005,2004,2003,2002,2001,2000,1999,1998,1997,1996,1995,1994,1993,1992,1991
This statistics in other country:
Timeline:
This timeline shows a graph from 1991 to 2016 of Niger. No data until 1990. Number of actual observations by date: 26.
Source name:
World Development Indicators
Source organization:
UNAIDS estimates.
Categories, topics:
Health, Gender
Last updated:
apr 23, 2017
Indicators value changes by year
Minimum:
45.902
jan 1, 2008
Maximum:
51.699
jan 1, 2016
At the date of observation
Value
Absolute change
Change from previous value
jan 1, 1991
46.49
+46.49
0.0%
jan 1, 1992
46.895
+0.405
0.87%
jan 1, 1993
47.188
+0.293
0.62%
jan 1, 1994
47.384
+0.196
0.41%
jan 1, 1995
47.468
+0.085
0.18%
jan 1, 1996
47.484
+0.016
0.03%
jan 1, 1997
47.417
-0.067
-0.14%
jan 1, 1998
47.299
-0.118
-0.25%
jan 1, 1999
47.162
-0.137
-0.29%
jan 1, 2000
47.033
-0.13
-0.28%
jan 1, 2001
46.935
-0.098
-0.21%
jan 1, 2002
46.845
-0.09
-0.19%
jan 1, 2003
46.736
-0.11
-0.23%
jan 1, 2004
46.59
-0.146
-0.31%
jan 1, 2005
46.407
-0.182
-0.39%
jan 1, 2006
46.21
-0.197
-0.42%
jan 1, 2007
46.024
-0.187
-0.4%
jan 1, 2008
45.902
-0.122
-0.27%
jan 1, 2009
45.943
+0.041
0.09%
jan 1, 2010
46.157
+0.214
0.47%
jan 1, 2011
46.626
+0.469
1.02%
jan 1, 2012
47.246
+0.62
1.33%
jan 1, 2013
48.039
+0.793
1.68%
jan 1, 2014
49.0
+0.961
2.0%
jan 1, 2015
50.246
+1.246
2.54%
jan 1, 2016
51.699
+1.453
2.89%
Ranking of countries by current statistics by years


Comments: