29
/
en
AIzaSyAYiBZKx7MnpbEhh9jyipgxe19OcubqV5w
April 1, 2024
162116
Italy
ITA
true
2
1
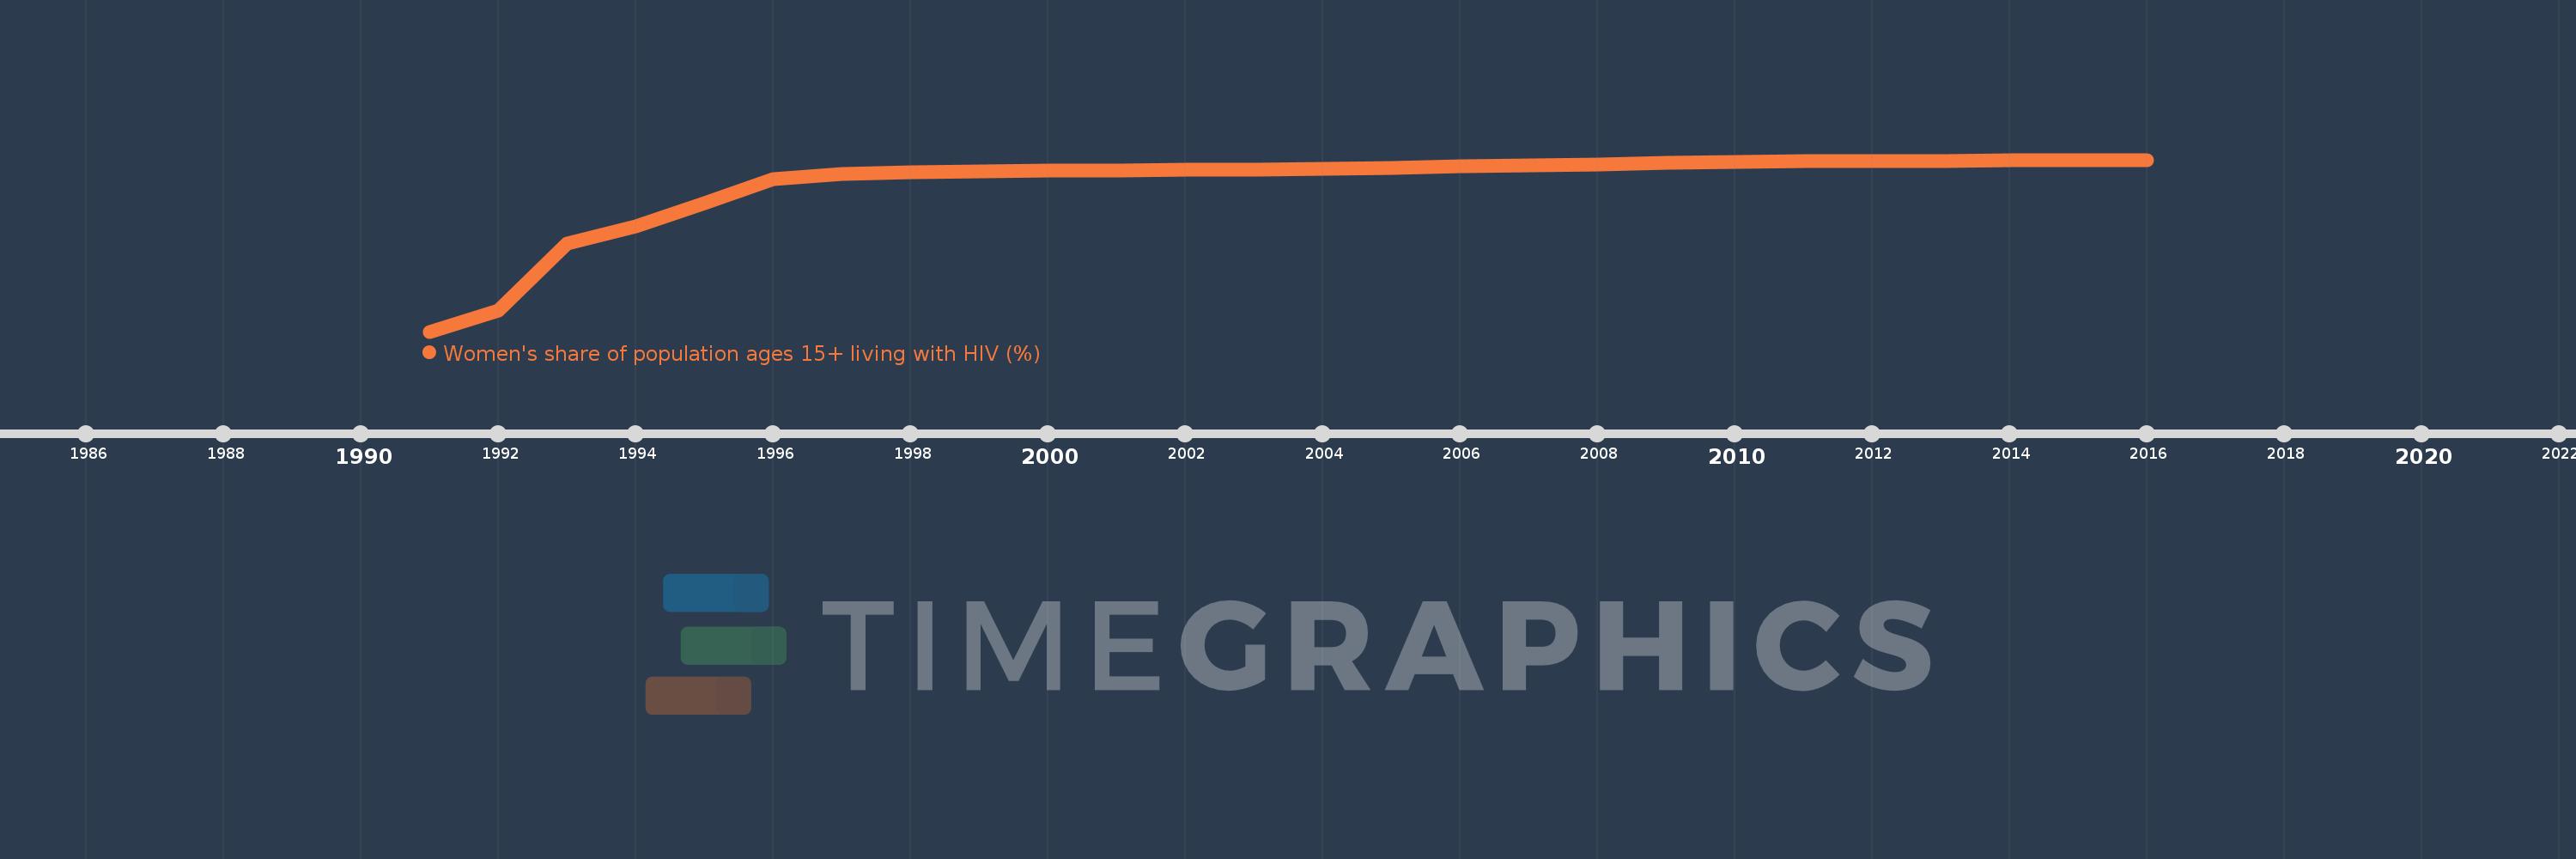
Women's share of population ages 15+ living with HIV (%)
2016,2015,2014,2013,2012,2011,2010,2009,2008,2007,2006,2005,2004,2003,2002,2001,2000,1999,1998,1997,1996,1995,1994,1993,1992,1991
This statistics in other country:
Timeline:
This timeline shows a graph from 1991 to 2016 of Italy. No data until 1990. Number of actual observations by date: 26.
Source name:
World Development Indicators
Source organization:
UNAIDS estimates.
Categories, topics:
Health, Gender
Last updated:
apr 23, 2017
Indicators value changes by year
Minimum:
18.798
jan 1, 1991
Maximum:
28.732
jan 1, 2016
At the date of observation
Value
Absolute change
Change from previous value
jan 1, 1991
18.798
+18.798
0.0%
jan 1, 1992
20.0
+1.202
6.39%
jan 1, 1993
23.913
+3.913
19.57%
jan 1, 1994
24.878
+0.965
4.04%
jan 1, 1995
26.233
+1.355
5.45%
jan 1, 1996
27.606
+1.373
5.23%
jan 1, 1997
27.923
+0.317
1.15%
jan 1, 1998
28.008
+0.085
0.3%
jan 1, 1999
28.05
+0.041
0.15%
jan 1, 2000
28.088
+0.039
0.14%
jan 1, 2001
28.118
+0.029
0.1%
jan 1, 2002
28.146
+0.029
0.1%
jan 1, 2003
28.174
+0.028
0.1%
jan 1, 2004
28.215
+0.041
0.14%
jan 1, 2005
28.267
+0.052
0.18%
jan 1, 2006
28.338
+0.071
0.25%
jan 1, 2007
28.411
+0.073
0.26%
jan 1, 2008
28.48
+0.07
0.25%
jan 1, 2009
28.545
+0.064
0.23%
jan 1, 2010
28.6
+0.055
0.19%
jan 1, 2011
28.634
+0.035
0.12%
jan 1, 2012
28.66
+0.025
0.09%
jan 1, 2013
28.681
+0.021
0.07%
jan 1, 2014
28.698
+0.018
0.06%
jan 1, 2015
28.715
+0.016
0.06%
jan 1, 2016
28.732
+0.017
0.06%
Ranking of countries by current statistics by years


Comments: