29
/
en
AIzaSyAYiBZKx7MnpbEhh9jyipgxe19OcubqV5w
April 1, 2024
203781
Mozambique
MOZ
true
2
1
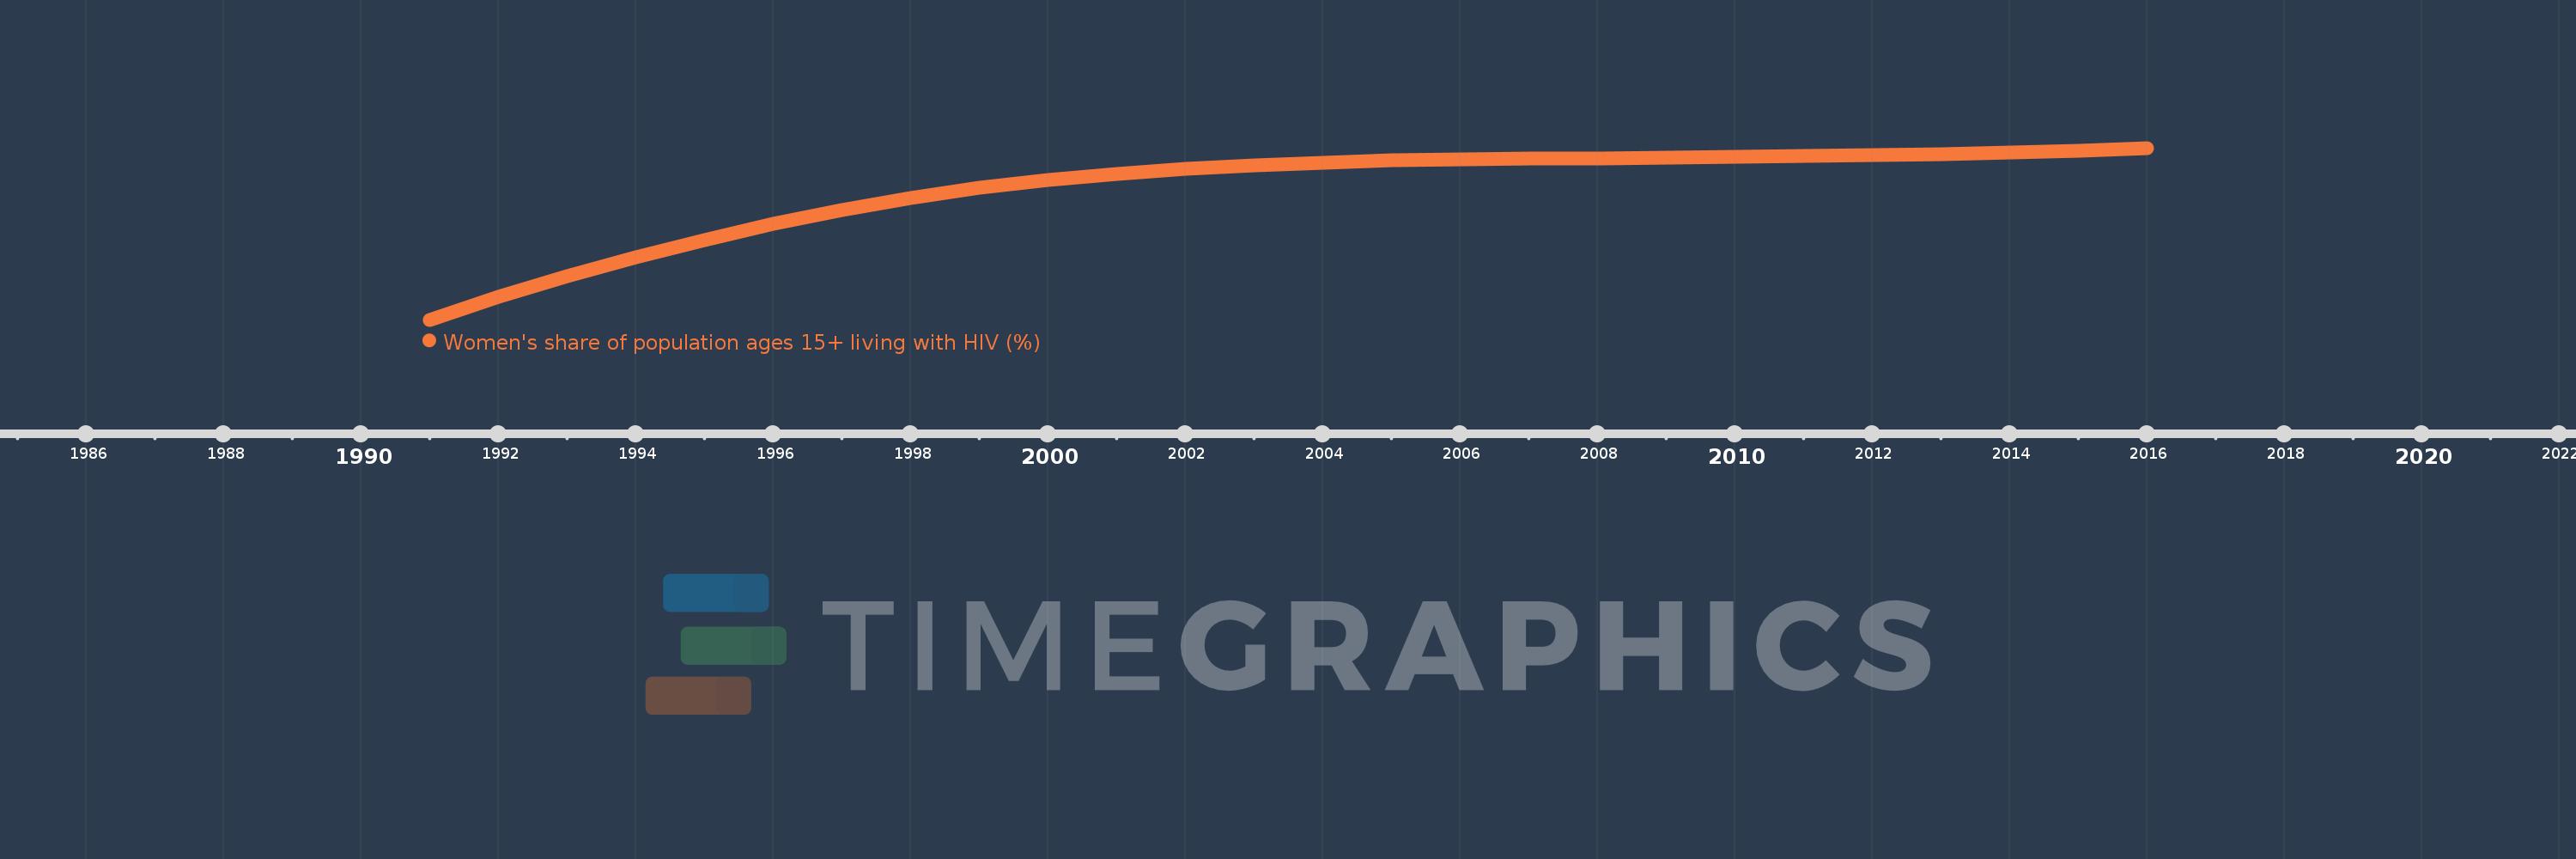
Women's share of population ages 15+ living with HIV (%)
2016,2015,2014,2013,2012,2011,2010,2009,2008,2007,2006,2005,2004,2003,2002,2001,2000,1999,1998,1997,1996,1995,1994,1993,1992,1991
This statistics in other country:
Timeline:
This timeline shows a graph from 1991 to 2016 of Mozambique. No data until 1990. Number of actual observations by date: 26.
Source name:
World Development Indicators
Source organization:
UNAIDS estimates.
Categories, topics:
Health, Gender
Last updated:
apr 23, 2017
Indicators value changes by year
Minimum:
44.395
jan 1, 1991
Maximum:
59.885
jan 1, 2016
At the date of observation
Value
Absolute change
Change from previous value
jan 1, 1991
44.395
+44.395
0.0%
jan 1, 1992
46.465
+2.07
4.66%
jan 1, 1993
48.302
+1.838
3.95%
jan 1, 1994
50.008
+1.706
3.53%
jan 1, 1995
51.584
+1.576
3.15%
jan 1, 1996
53.032
+1.447
2.81%
jan 1, 1997
54.315
+1.283
2.42%
jan 1, 1998
55.396
+1.081
1.99%
jan 1, 1999
56.273
+0.877
1.58%
jan 1, 2000
56.985
+0.712
1.27%
jan 1, 2001
57.546
+0.56
0.98%
jan 1, 2002
57.99
+0.444
0.77%
jan 1, 2003
58.327
+0.337
0.58%
jan 1, 2004
58.575
+0.248
0.43%
jan 1, 2005
58.758
+0.183
0.31%
jan 1, 2006
58.869
+0.11
0.19%
jan 1, 2007
58.927
+0.058
0.1%
jan 1, 2008
58.952
+0.025
0.04%
jan 1, 2009
59.009
+0.057
0.1%
jan 1, 2010
59.058
+0.049
0.08%
jan 1, 2011
59.128
+0.07
0.12%
jan 1, 2012
59.223
+0.095
0.16%
jan 1, 2013
59.316
+0.093
0.16%
jan 1, 2014
59.441
+0.124
0.21%
jan 1, 2015
59.639
+0.198
0.33%
jan 1, 2016
59.885
+0.247
0.41%
Ranking of countries by current statistics by years


Comments: