29
/
en
AIzaSyAYiBZKx7MnpbEhh9jyipgxe19OcubqV5w
April 1, 2024
200032
Mongolia
MNG
true
2
1
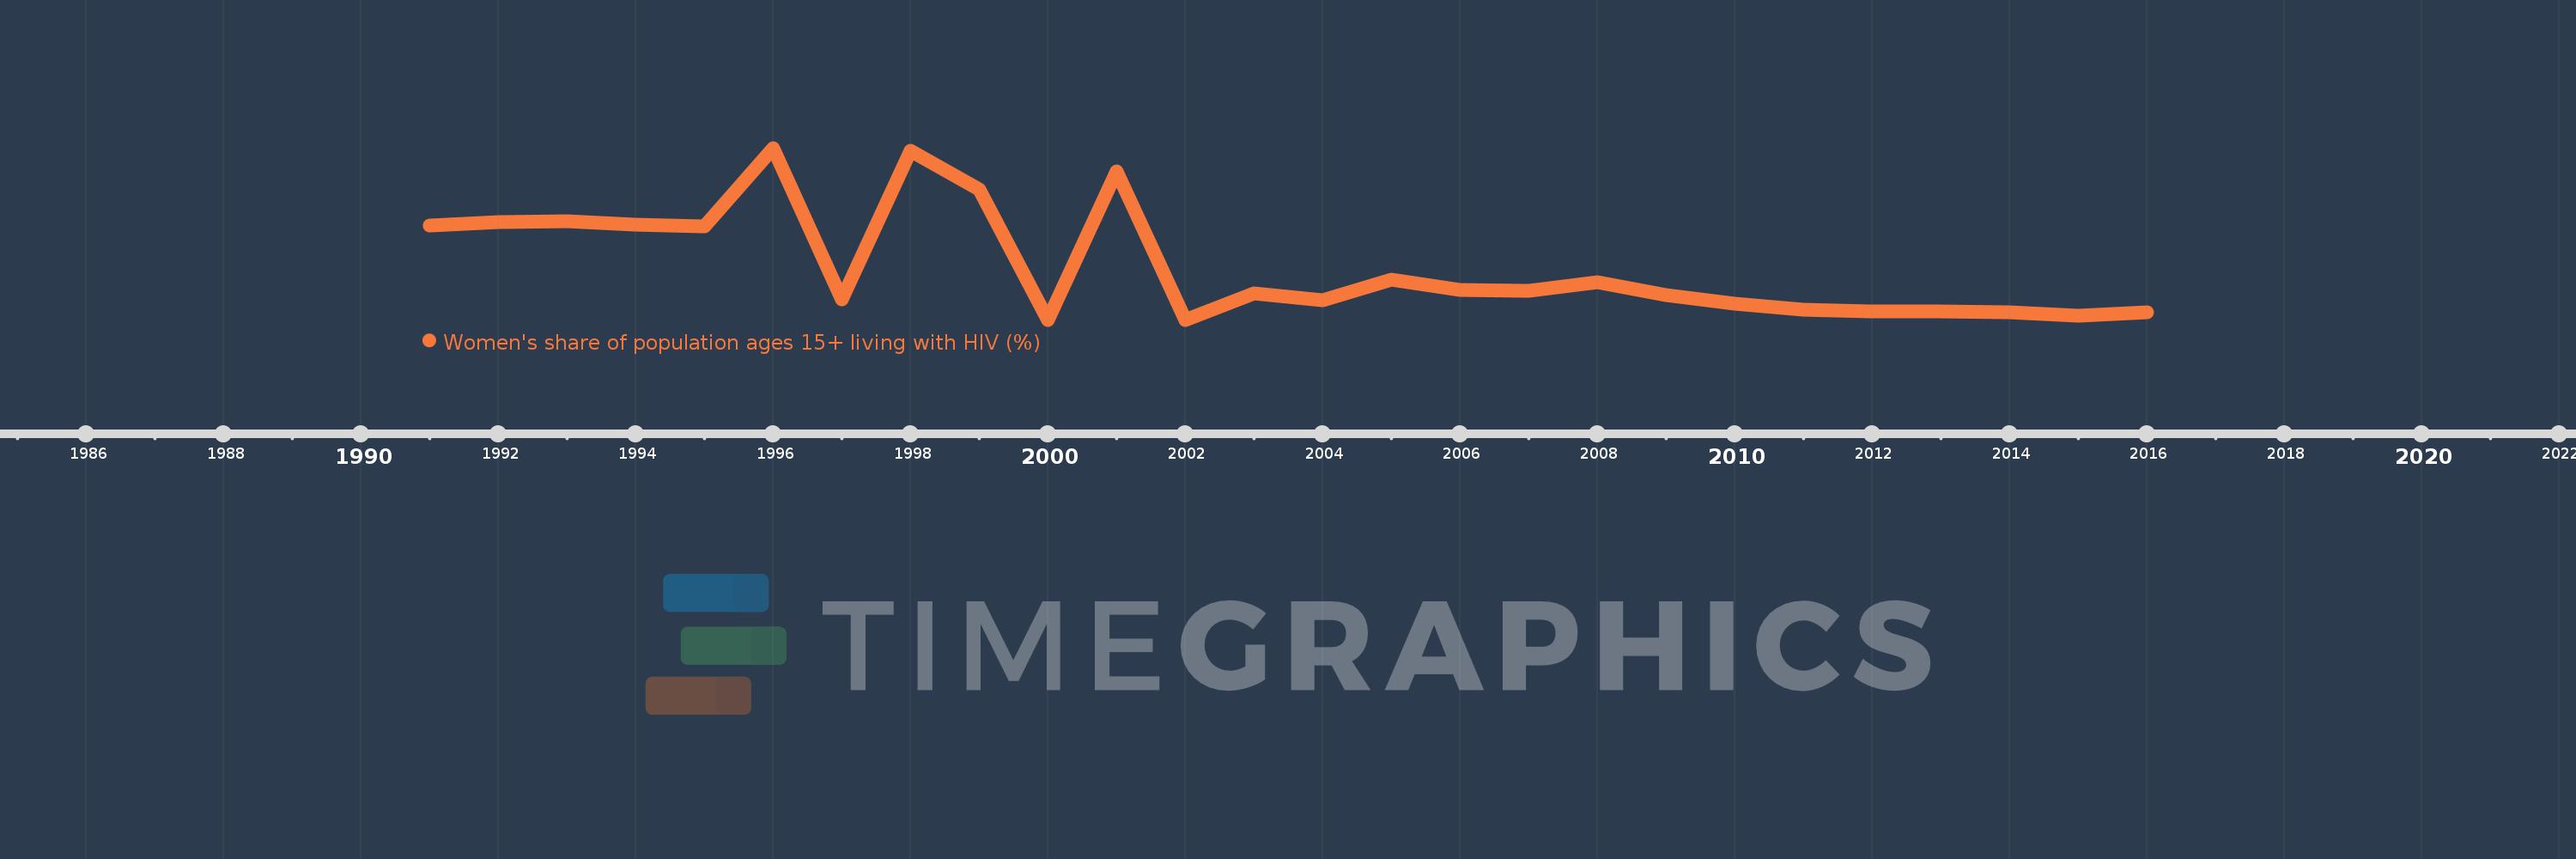
Women's share of population ages 15+ living with HIV (%)
2016,2015,2014,2013,2012,2011,2010,2009,2008,2007,2006,2005,2004,2003,2002,2001,2000,1999,1998,1997,1996,1995,1994,1993,1992,1991
This statistics in other country:
Timeline:
This timeline shows a graph from 1991 to 2016 of Mongolia. No data until 1990. Number of actual observations by date: 26.
Source name:
World Development Indicators
Source organization:
UNAIDS estimates.
Categories, topics:
Health, Gender
Last updated:
apr 23, 2017
Indicators value changes by year
Minimum:
16.667
jan 1, 2000
Maximum:
23.118
jan 1, 1996
At the date of observation
Value
Absolute change
Change from previous value
jan 1, 1991
20.211
+20.211
0.0%
jan 1, 1992
20.326
+0.116
0.57%
jan 1, 1993
20.359
+0.032
0.16%
jan 1, 1994
20.249
-0.11
-0.54%
jan 1, 1995
20.161
-0.088
-0.43%
jan 1, 1996
23.118
+2.957
14.67%
jan 1, 1997
17.43
-5.688
-24.6%
jan 1, 1998
22.997
+5.567
31.94%
jan 1, 1999
21.56
-1.437
-6.25%
jan 1, 2000
16.667
-4.894
-22.7%
jan 1, 2001
22.222
+5.556
33.33%
jan 1, 2002
16.667
-5.556
-25.0%
jan 1, 2003
17.647
+0.98
5.88%
jan 1, 2004
17.391
-0.256
-1.45%
jan 1, 2005
18.182
+0.791
4.55%
jan 1, 2006
17.778
-0.404
-2.22%
jan 1, 2007
17.742
-0.036
-0.2%
jan 1, 2008
18.072
+0.33
1.86%
jan 1, 2009
17.593
-0.48
-2.65%
jan 1, 2010
17.266
-0.326
-1.86%
jan 1, 2011
17.045
-0.221
-1.28%
jan 1, 2012
16.972
-0.073
-0.43%
jan 1, 2013
16.981
+0.009
0.05%
jan 1, 2014
16.933
-0.048
-0.28%
jan 1, 2015
16.804
-0.128
-0.76%
jan 1, 2016
16.949
+0.145
0.86%
Ranking of countries by current statistics by years


Comments: