29
/
en
AIzaSyAYiBZKx7MnpbEhh9jyipgxe19OcubqV5w
April 1, 2024
220369
Papua New Guinea
PNG
true
2
1
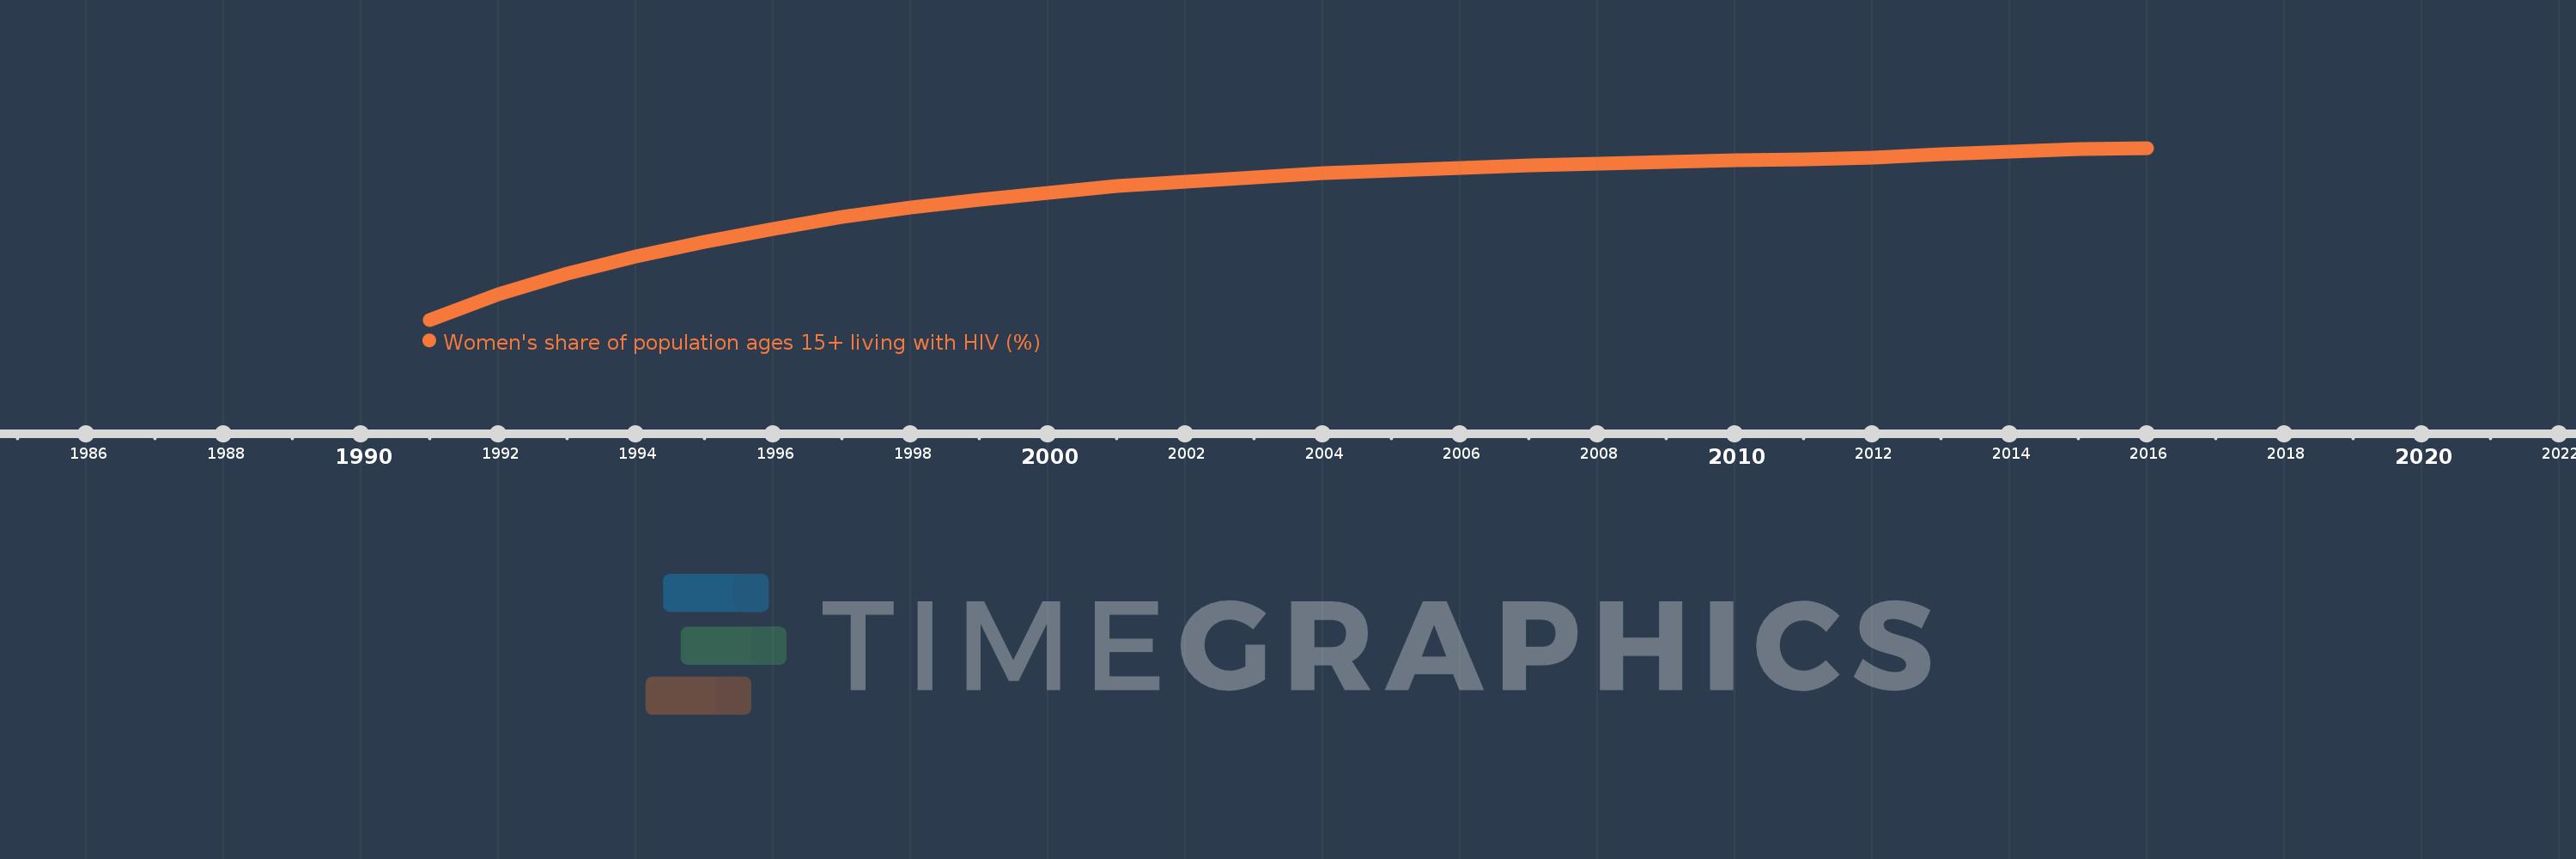
Women's share of population ages 15+ living with HIV (%)
2016,2015,2014,2013,2012,2011,2010,2009,2008,2007,2006,2005,2004,2003,2002,2001,2000,1999,1998,1997,1996,1995,1994,1993,1992,1991
This statistics in other country:
Timeline:
This timeline shows a graph from 1991 to 2016 of Papua New Guinea. No data until 1990. Number of actual observations by date: 26.
Source name:
World Development Indicators
Source organization:
UNAIDS estimates.
Categories, topics:
Health, Gender
Last updated:
apr 23, 2017
Indicators value changes by year
Minimum:
43.296
jan 1, 1991
Maximum:
57.662
jan 1, 2016
At the date of observation
Value
Absolute change
Change from previous value
jan 1, 1991
43.296
+43.296
0.0%
jan 1, 1992
45.425
+2.129
4.92%
jan 1, 1993
47.153
+1.728
3.8%
jan 1, 1994
48.597
+1.444
3.06%
jan 1, 1995
49.834
+1.237
2.55%
jan 1, 1996
50.924
+1.09
2.19%
jan 1, 1997
51.864
+0.94
1.85%
jan 1, 1998
52.655
+0.791
1.53%
jan 1, 1999
53.345
+0.69
1.31%
jan 1, 2000
53.928
+0.583
1.09%
jan 1, 2001
54.453
+0.525
0.97%
jan 1, 2002
54.869
+0.416
0.76%
jan 1, 2003
55.223
+0.354
0.65%
jan 1, 2004
55.527
+0.304
0.55%
jan 1, 2005
55.783
+0.256
0.46%
jan 1, 2006
56.008
+0.225
0.4%
jan 1, 2007
56.205
+0.197
0.35%
jan 1, 2008
56.369
+0.164
0.29%
jan 1, 2009
56.497
+0.128
0.23%
jan 1, 2010
56.606
+0.109
0.19%
jan 1, 2011
56.719
+0.112
0.2%
jan 1, 2012
56.886
+0.167
0.3%
jan 1, 2013
57.148
+0.262
0.46%
jan 1, 2014
57.376
+0.229
0.4%
jan 1, 2015
57.541
+0.165
0.29%
jan 1, 2016
57.662
+0.121
0.21%
Ranking of countries by current statistics by years


Comments: