29
/
en
AIzaSyAYiBZKx7MnpbEhh9jyipgxe19OcubqV5w
April 1, 2024
281835
Venezuela, RB
VEN
true
2
1
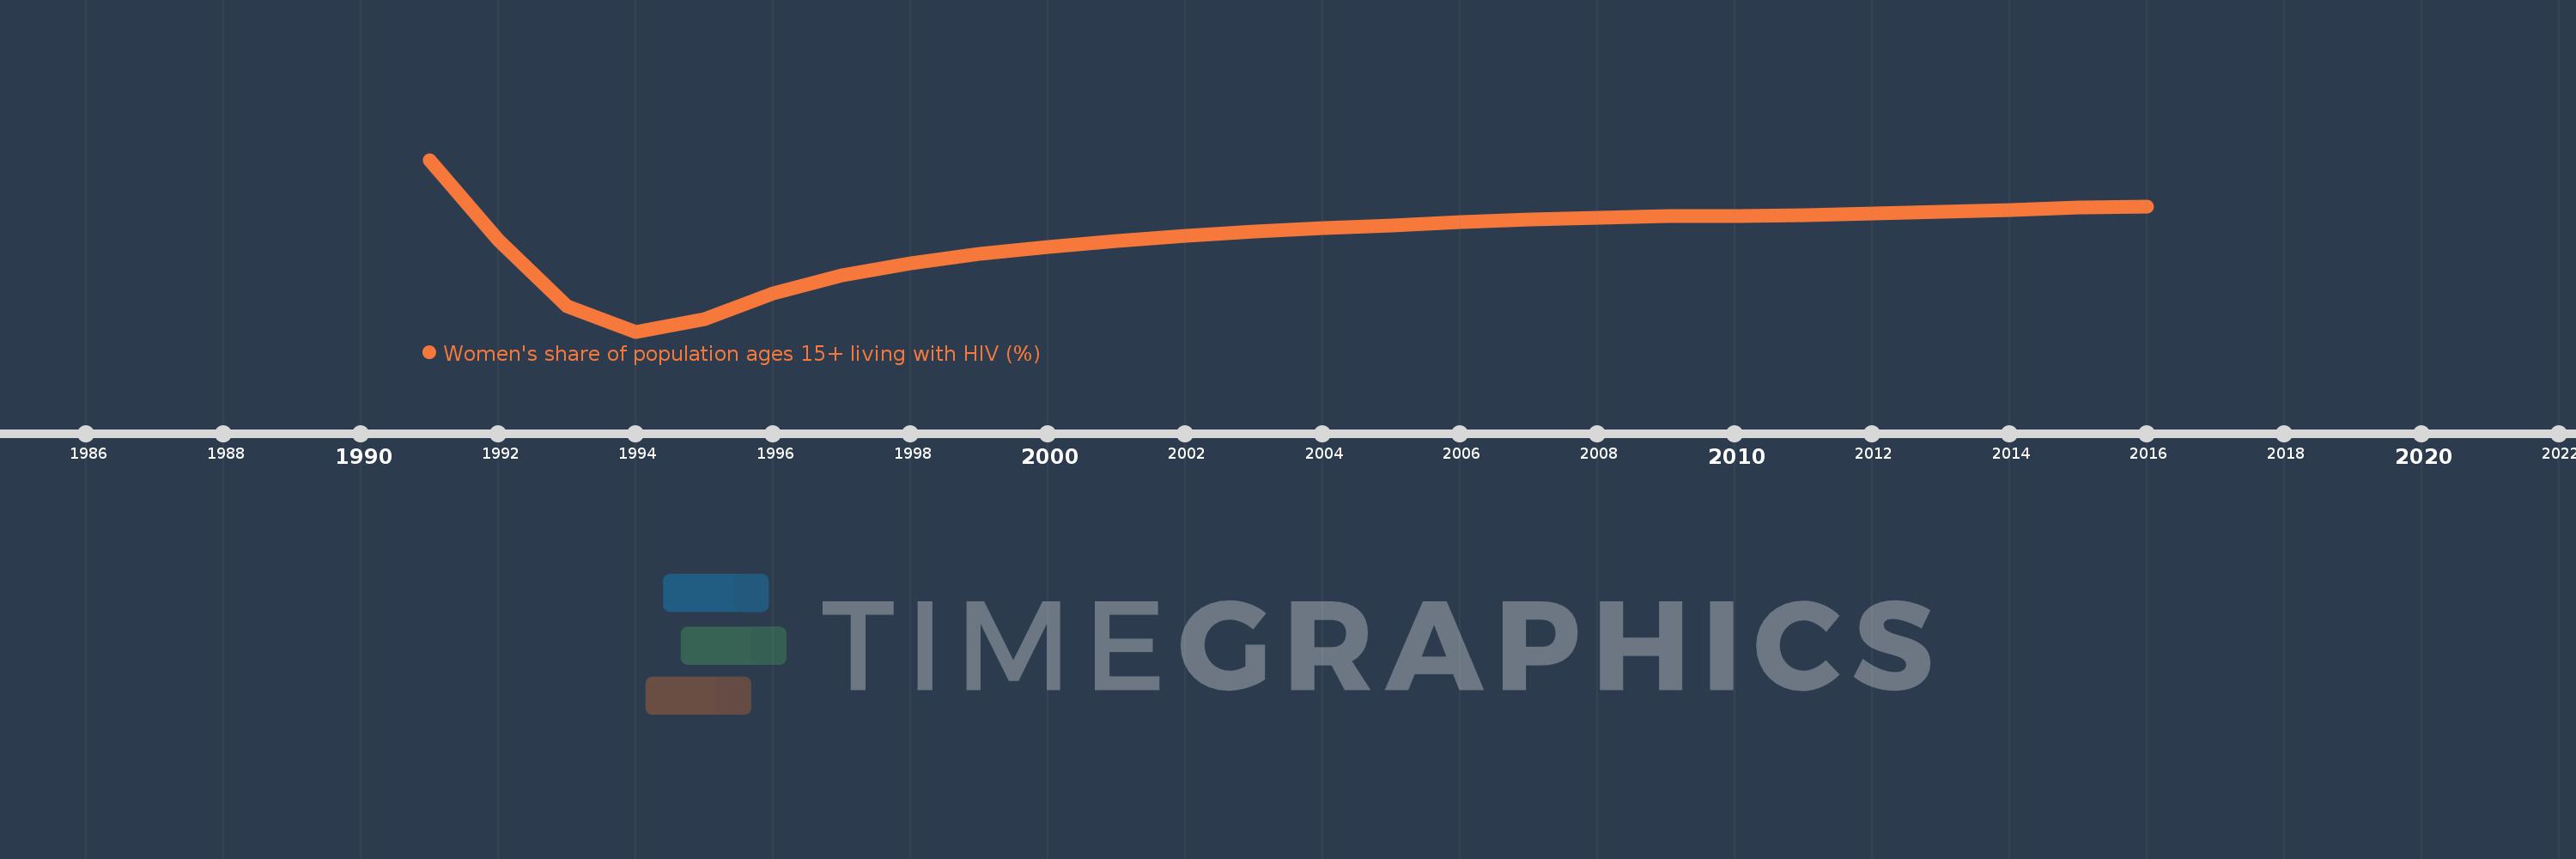
Women's share of population ages 15+ living with HIV (%)
2016,2015,2014,2013,2012,2011,2010,2009,2008,2007,2006,2005,2004,2003,2002,2001,2000,1999,1998,1997,1996,1995,1994,1993,1992,1991
This statistics in other country:
Timeline:
This timeline shows a graph from 1991 to 2016 of Venezuela, RB. No data until 1990. Number of actual observations by date: 26.
Source name:
World Development Indicators
Source organization:
UNAIDS estimates.
Categories, topics:
Health, Gender
Last updated:
apr 23, 2017
Indicators value changes by year
Minimum:
17.901
jan 1, 1994
Maximum:
41.434
jan 1, 1991
At the date of observation
Value
Absolute change
Change from previous value
jan 1, 1991
41.434
+41.434
0.0%
jan 1, 1992
30.385
-11.05
-26.67%
jan 1, 1993
21.368
-9.016
-29.67%
jan 1, 1994
17.901
-3.467
-16.23%
jan 1, 1995
19.63
+1.729
9.66%
jan 1, 1996
23.142
+3.512
17.89%
jan 1, 1997
25.658
+2.516
10.87%
jan 1, 1998
27.294
+1.636
6.37%
jan 1, 1999
28.508
+1.214
4.45%
jan 1, 2000
29.469
+0.96
3.37%
jan 1, 2001
30.333
+0.864
2.93%
jan 1, 2002
31.052
+0.719
2.37%
jan 1, 2003
31.586
+0.533
1.72%
jan 1, 2004
32.047
+0.461
1.46%
jan 1, 2005
32.471
+0.424
1.32%
jan 1, 2006
32.862
+0.39
1.2%
jan 1, 2007
33.217
+0.355
1.08%
jan 1, 2008
33.542
+0.325
0.98%
jan 1, 2009
33.725
+0.183
0.55%
jan 1, 2010
33.742
+0.017
0.05%
jan 1, 2011
33.826
+0.084
0.25%
jan 1, 2012
34.054
+0.228
0.67%
jan 1, 2013
34.322
+0.268
0.79%
jan 1, 2014
34.596
+0.273
0.8%
jan 1, 2015
34.866
+0.27
0.78%
jan 1, 2016
35.04
+0.174
0.5%
Ranking of countries by current statistics by years


Comments: