29
/
en
AIzaSyAYiBZKx7MnpbEhh9jyipgxe19OcubqV5w
April 1, 2024
247205
South Sudan
SSD
true
2
1
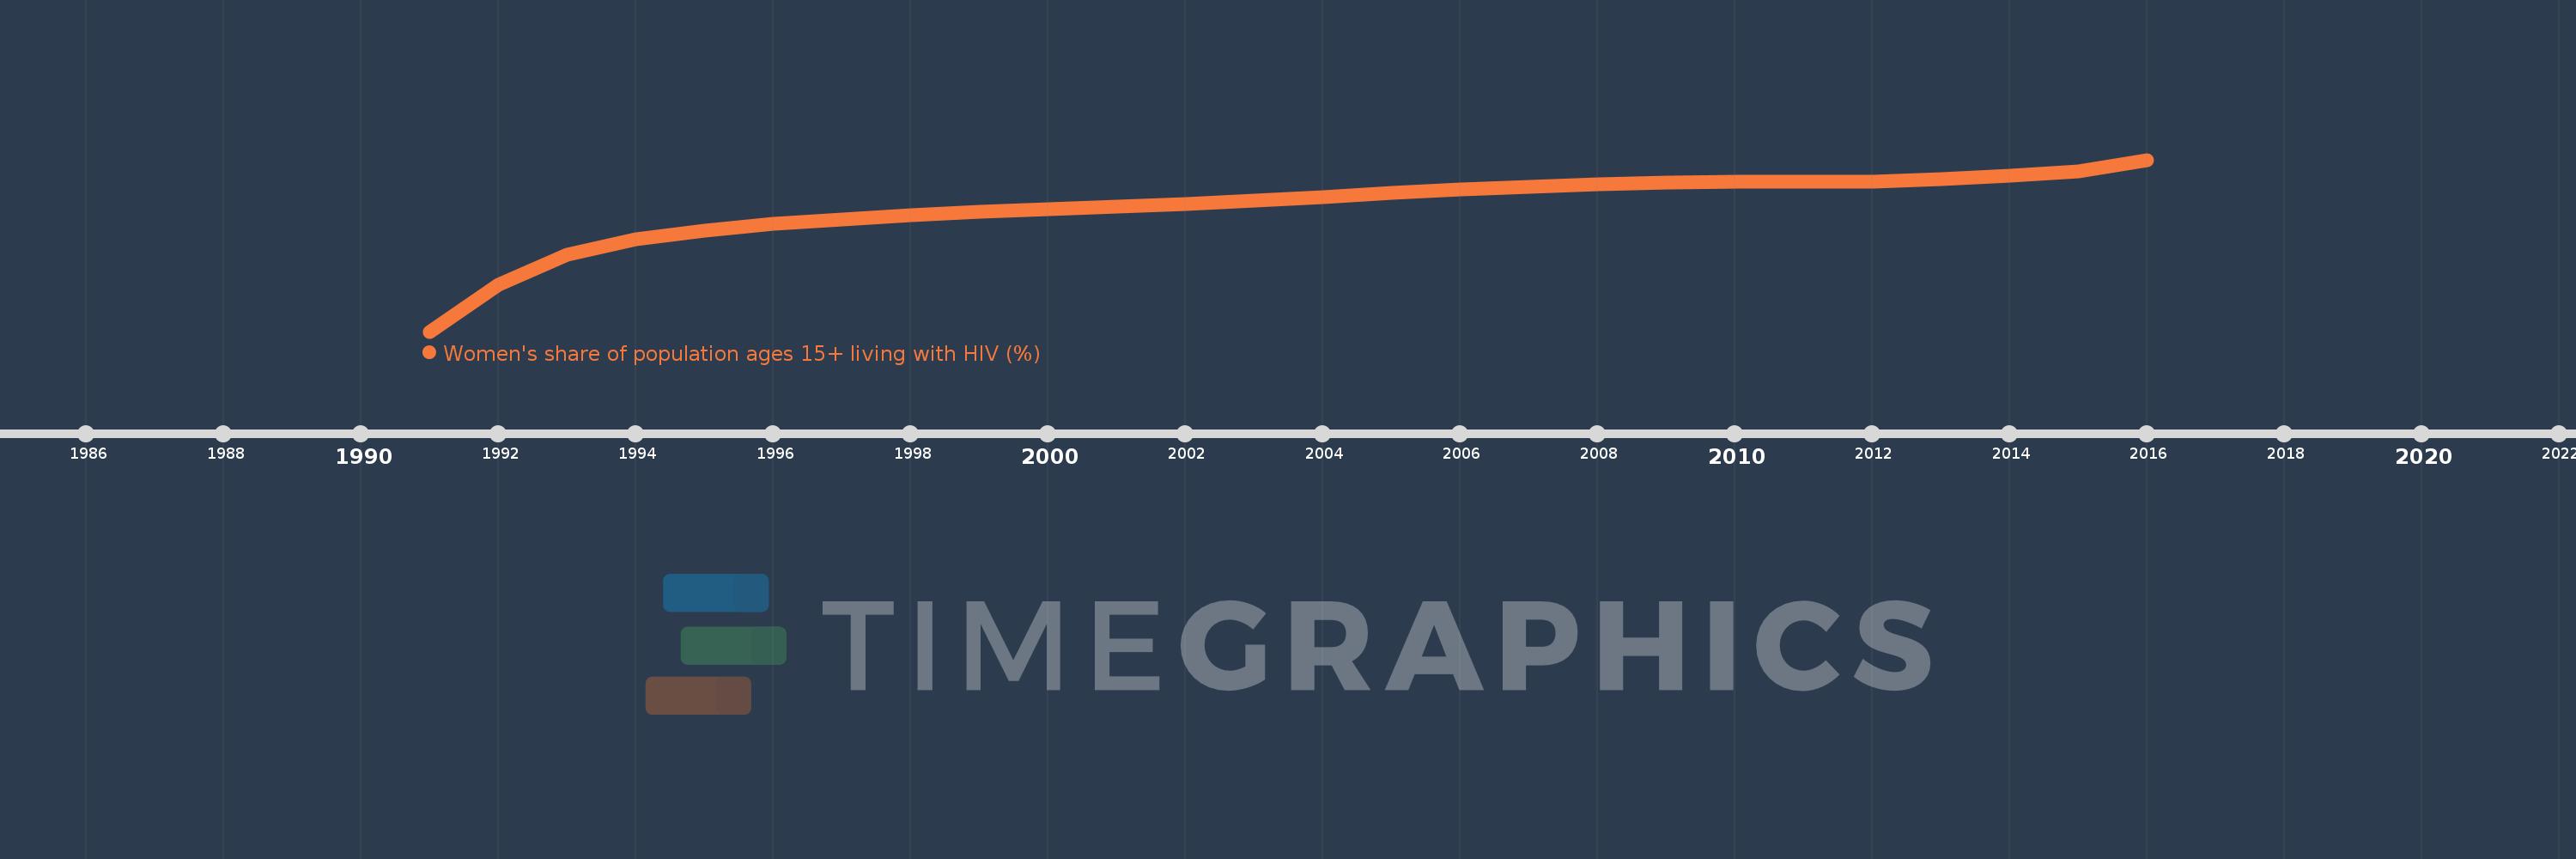
Women's share of population ages 15+ living with HIV (%)
2016,2015,2014,2013,2012,2011,2010,2009,2008,2007,2006,2005,2004,2003,2002,2001,2000,1999,1998,1997,1996,1995,1994,1993,1992,1991
This statistics in other country:
Timeline:
This timeline shows a graph from 1991 to 2016 of South Sudan. No data until 1990. Number of actual observations by date: 26.
Source name:
World Development Indicators
Source organization:
UNAIDS estimates.
Categories, topics:
Health, Gender
Last updated:
apr 23, 2017
Indicators value changes by year
Minimum:
56.784
jan 1, 1991
Maximum:
58.591
jan 1, 2016
At the date of observation
Value
Absolute change
Change from previous value
jan 1, 1991
56.784
+56.784
0.0%
jan 1, 1992
57.272
+0.488
0.86%
jan 1, 1993
57.592
+0.32
0.56%
jan 1, 1994
57.755
+0.163
0.28%
jan 1, 1995
57.848
+0.094
0.16%
jan 1, 1996
57.916
+0.067
0.12%
jan 1, 1997
57.966
+0.05
0.09%
jan 1, 1998
58.007
+0.041
0.07%
jan 1, 1999
58.042
+0.035
0.06%
jan 1, 2000
58.073
+0.032
0.05%
jan 1, 2001
58.102
+0.029
0.05%
jan 1, 2002
58.129
+0.027
0.05%
jan 1, 2003
58.158
+0.029
0.05%
jan 1, 2004
58.199
+0.042
0.07%
jan 1, 2005
58.241
+0.041
0.07%
jan 1, 2006
58.279
+0.038
0.07%
jan 1, 2007
58.308
+0.029
0.05%
jan 1, 2008
58.334
+0.026
0.04%
jan 1, 2009
58.351
+0.017
0.03%
jan 1, 2010
58.361
+0.01
0.02%
jan 1, 2011
58.36
-0.001
0.0%
jan 1, 2012
58.358
-0.003
0.0%
jan 1, 2013
58.392
+0.034
0.06%
jan 1, 2014
58.424
+0.032
0.05%
jan 1, 2015
58.472
+0.048
0.08%
jan 1, 2016
58.591
+0.119
0.2%
Ranking of countries by current statistics by years


Comments: