29
/
en
AIzaSyAYiBZKx7MnpbEhh9jyipgxe19OcubqV5w
April 1, 2024
288083
Zimbabwe
ZWE
true
2
1
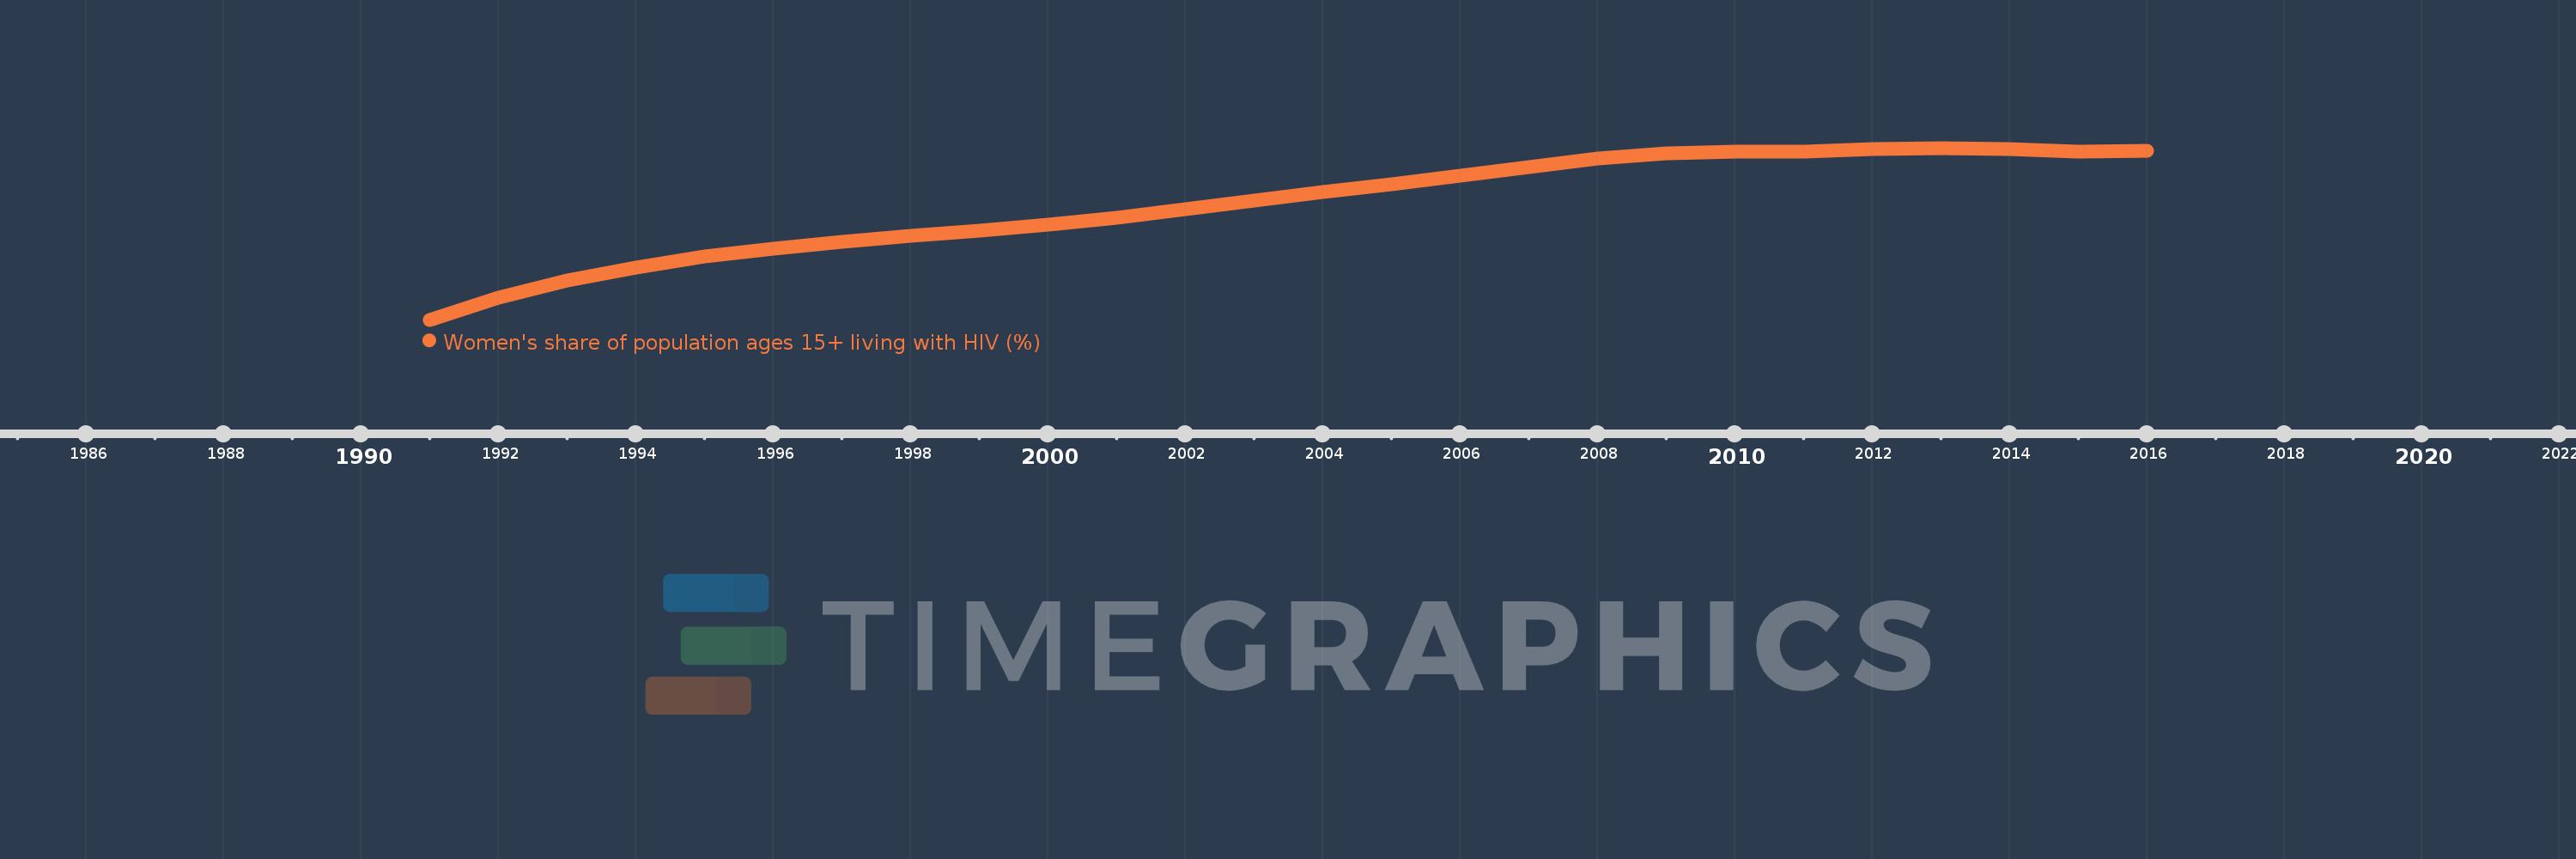
Women's share of population ages 15+ living with HIV (%)
2016,2015,2014,2013,2012,2011,2010,2009,2008,2007,2006,2005,2004,2003,2002,2001,2000,1999,1998,1997,1996,1995,1994,1993,1992,1991
This statistics in other country:
Timeline:
This timeline shows a graph from 1991 to 2016 of Zimbabwe. No data until 1990. Number of actual observations by date: 26.
Source name:
World Development Indicators
Source organization:
UNAIDS estimates.
Categories, topics:
Health, Gender
Last updated:
apr 23, 2017
Indicators value changes by year
Maximum:
58.939
jan 1, 2013
At the date of observation
Value
Absolute change
Change from previous value
jan 1, 1991
53.38
+53.38
0.0%
jan 1, 1992
54.086
+0.705
1.32%
jan 1, 1993
54.637
+0.551
1.02%
jan 1, 1994
55.076
+0.439
0.8%
jan 1, 1995
55.415
+0.339
0.62%
jan 1, 1996
55.675
+0.259
0.47%
jan 1, 1997
55.896
+0.222
0.4%
jan 1, 1998
56.083
+0.186
0.33%
jan 1, 1999
56.259
+0.176
0.31%
jan 1, 2000
56.447
+0.188
0.33%
jan 1, 2001
56.685
+0.238
0.42%
jan 1, 2002
56.949
+0.264
0.47%
jan 1, 2003
57.225
+0.276
0.49%
jan 1, 2004
57.5
+0.275
0.48%
jan 1, 2005
57.77
+0.27
0.47%
jan 1, 2006
58.046
+0.276
0.48%
jan 1, 2007
58.331
+0.286
0.49%
jan 1, 2008
58.586
+0.255
0.44%
jan 1, 2009
58.761
+0.175
0.3%
jan 1, 2010
58.812
+0.052
0.09%
jan 1, 2011
58.826
+0.014
0.02%
jan 1, 2012
58.899
+0.073
0.12%
jan 1, 2013
58.939
+0.04
0.07%
jan 1, 2014
58.9
-0.039
-0.07%
jan 1, 2015
58.822
-0.078
-0.13%
jan 1, 2016
58.856
+0.033
0.06%
Ranking of countries by current statistics by years


Comments: