29
/
en
AIzaSyAYiBZKx7MnpbEhh9jyipgxe19OcubqV5w
April 1, 2024
72033
Armenia
ARM
true
2
1
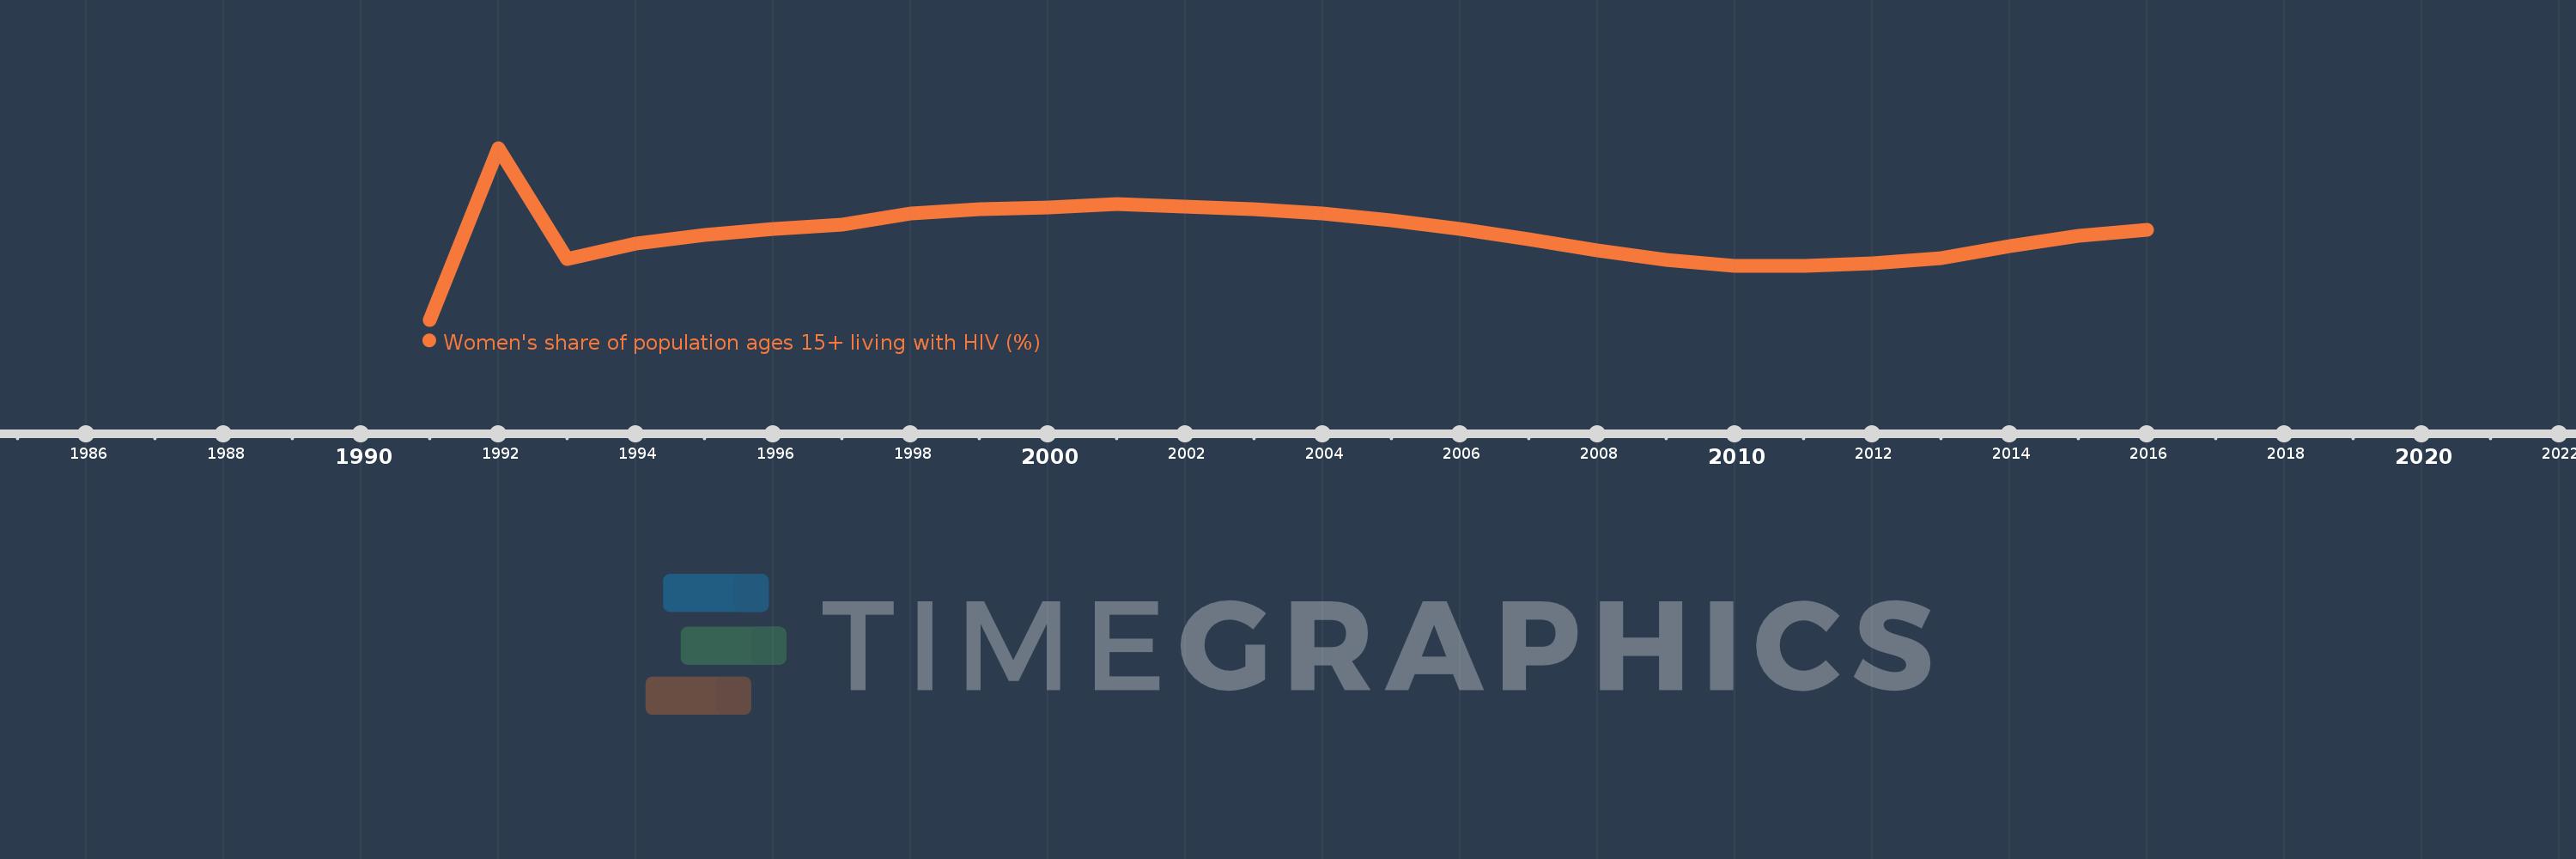
Women's share of population ages 15+ living with HIV (%)
2016,2015,2014,2013,2012,2011,2010,2009,2008,2007,2006,2005,2004,2003,2002,2001,2000,1999,1998,1997,1996,1995,1994,1993,1992,1991
This statistics in other country:
Timeline:
This timeline shows a graph from 1991 to 2016 of Armenia. No data until 1990. Number of actual observations by date: 26.
Source name:
World Development Indicators
Source organization:
UNAIDS estimates.
Categories, topics:
Health, Gender
Last updated:
apr 23, 2017
Indicators value changes by year
Minimum:
16.868
jan 1, 1991
Maximum:
22.222
jan 1, 1992
At the date of observation
Value
Absolute change
Change from previous value
jan 1, 1991
16.868
+16.868
0.0%
jan 1, 1992
22.222
+5.355
31.75%
jan 1, 1993
18.75
-3.472
-15.62%
jan 1, 1994
19.231
+0.481
2.56%
jan 1, 1995
19.512
+0.281
1.46%
jan 1, 1996
19.697
+0.185
0.95%
jan 1, 1997
19.828
+0.131
0.66%
jan 1, 1998
20.188
+0.36
1.82%
jan 1, 1999
20.313
+0.125
0.62%
jan 1, 2000
20.373
+0.061
0.3%
jan 1, 2001
20.471
+0.098
0.48%
jan 1, 2002
20.391
-0.08
-0.39%
jan 1, 2003
20.323
-0.068
-0.34%
jan 1, 2004
20.168
-0.154
-0.76%
jan 1, 2005
19.956
-0.212
-1.05%
jan 1, 2006
19.696
-0.26
-1.3%
jan 1, 2007
19.377
-0.319
-1.62%
jan 1, 2008
19.015
-0.362
-1.87%
jan 1, 2009
18.724
-0.291
-1.53%
jan 1, 2010
18.546
-0.177
-0.95%
jan 1, 2011
18.546
-0.001
0.0%
jan 1, 2012
18.615
+0.069
0.37%
jan 1, 2013
18.783
+0.167
0.9%
jan 1, 2014
19.172
+0.39
2.08%
jan 1, 2015
19.472
+0.299
1.56%
jan 1, 2016
19.661
+0.189
0.97%
Ranking of countries by current statistics by years


Comments: