29
/
en
AIzaSyAYiBZKx7MnpbEhh9jyipgxe19OcubqV5w
April 1, 2024
142470
Greece
GRC
true
2
1
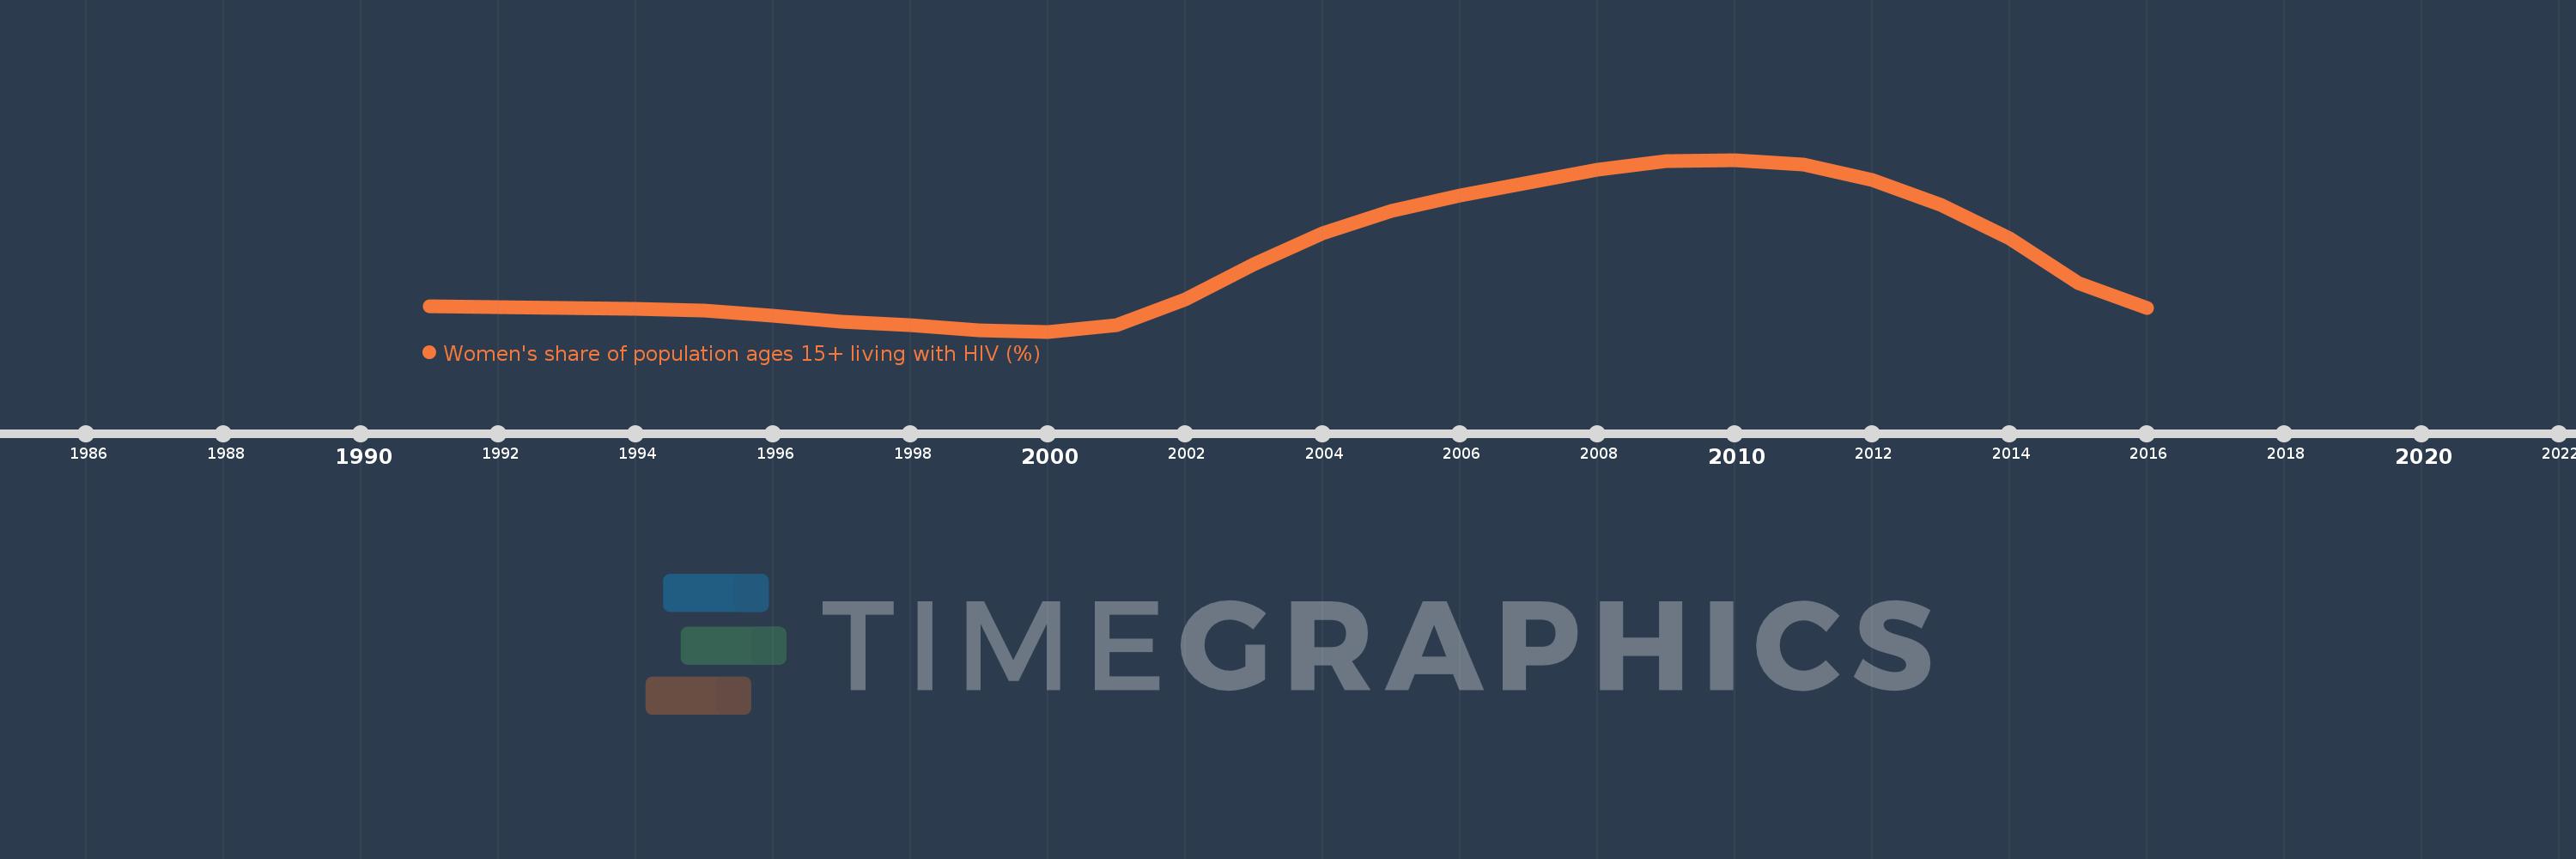
Women's share of population ages 15+ living with HIV (%)
2016,2015,2014,2013,2012,2011,2010,2009,2008,2007,2006,2005,2004,2003,2002,2001,2000,1999,1998,1997,1996,1995,1994,1993,1992,1991
This statistics in other country:
Timeline:
This timeline shows a graph from 1991 to 2016 of Greece. No data until 1990. Number of actual observations by date: 26.
Source name:
World Development Indicators
Source organization:
UNAIDS estimates.
Categories, topics:
Health, Gender
Last updated:
apr 23, 2017
Indicators value changes by year
Minimum:
18.195
jan 1, 2000
Maximum:
18.745
jan 1, 2010
At the date of observation
Value
Absolute change
Change from previous value
jan 1, 1991
18.275
+18.275
0.0%
jan 1, 1992
18.273
-0.002
-0.01%
jan 1, 1993
18.271
-0.002
-0.01%
jan 1, 1994
18.267
-0.004
-0.02%
jan 1, 1995
18.262
-0.005
-0.03%
jan 1, 1996
18.246
-0.016
-0.09%
jan 1, 1997
18.228
-0.018
-0.1%
jan 1, 1998
18.215
-0.013
-0.07%
jan 1, 1999
18.198
-0.017
-0.09%
jan 1, 2000
18.195
-0.003
-0.01%
jan 1, 2001
18.215
+0.02
0.11%
jan 1, 2002
18.299
+0.084
0.46%
jan 1, 2003
18.411
+0.112
0.61%
jan 1, 2004
18.509
+0.098
0.53%
jan 1, 2005
18.581
+0.072
0.39%
jan 1, 2006
18.632
+0.051
0.28%
jan 1, 2007
18.673
+0.041
0.22%
jan 1, 2008
18.714
+0.041
0.22%
jan 1, 2009
18.74
+0.026
0.14%
jan 1, 2010
18.745
+0.005
0.03%
jan 1, 2011
18.731
-0.014
-0.07%
jan 1, 2012
18.68
-0.052
-0.28%
jan 1, 2013
18.602
-0.077
-0.41%
jan 1, 2014
18.494
-0.108
-0.58%
jan 1, 2015
18.35
-0.145
-0.78%
jan 1, 2016
18.27
-0.079
-0.43%
Ranking of countries by current statistics by years


Comments: