29
/
en
AIzaSyAYiBZKx7MnpbEhh9jyipgxe19OcubqV5w
April 1, 2024
116344
Cuba
CUB
true
2
1
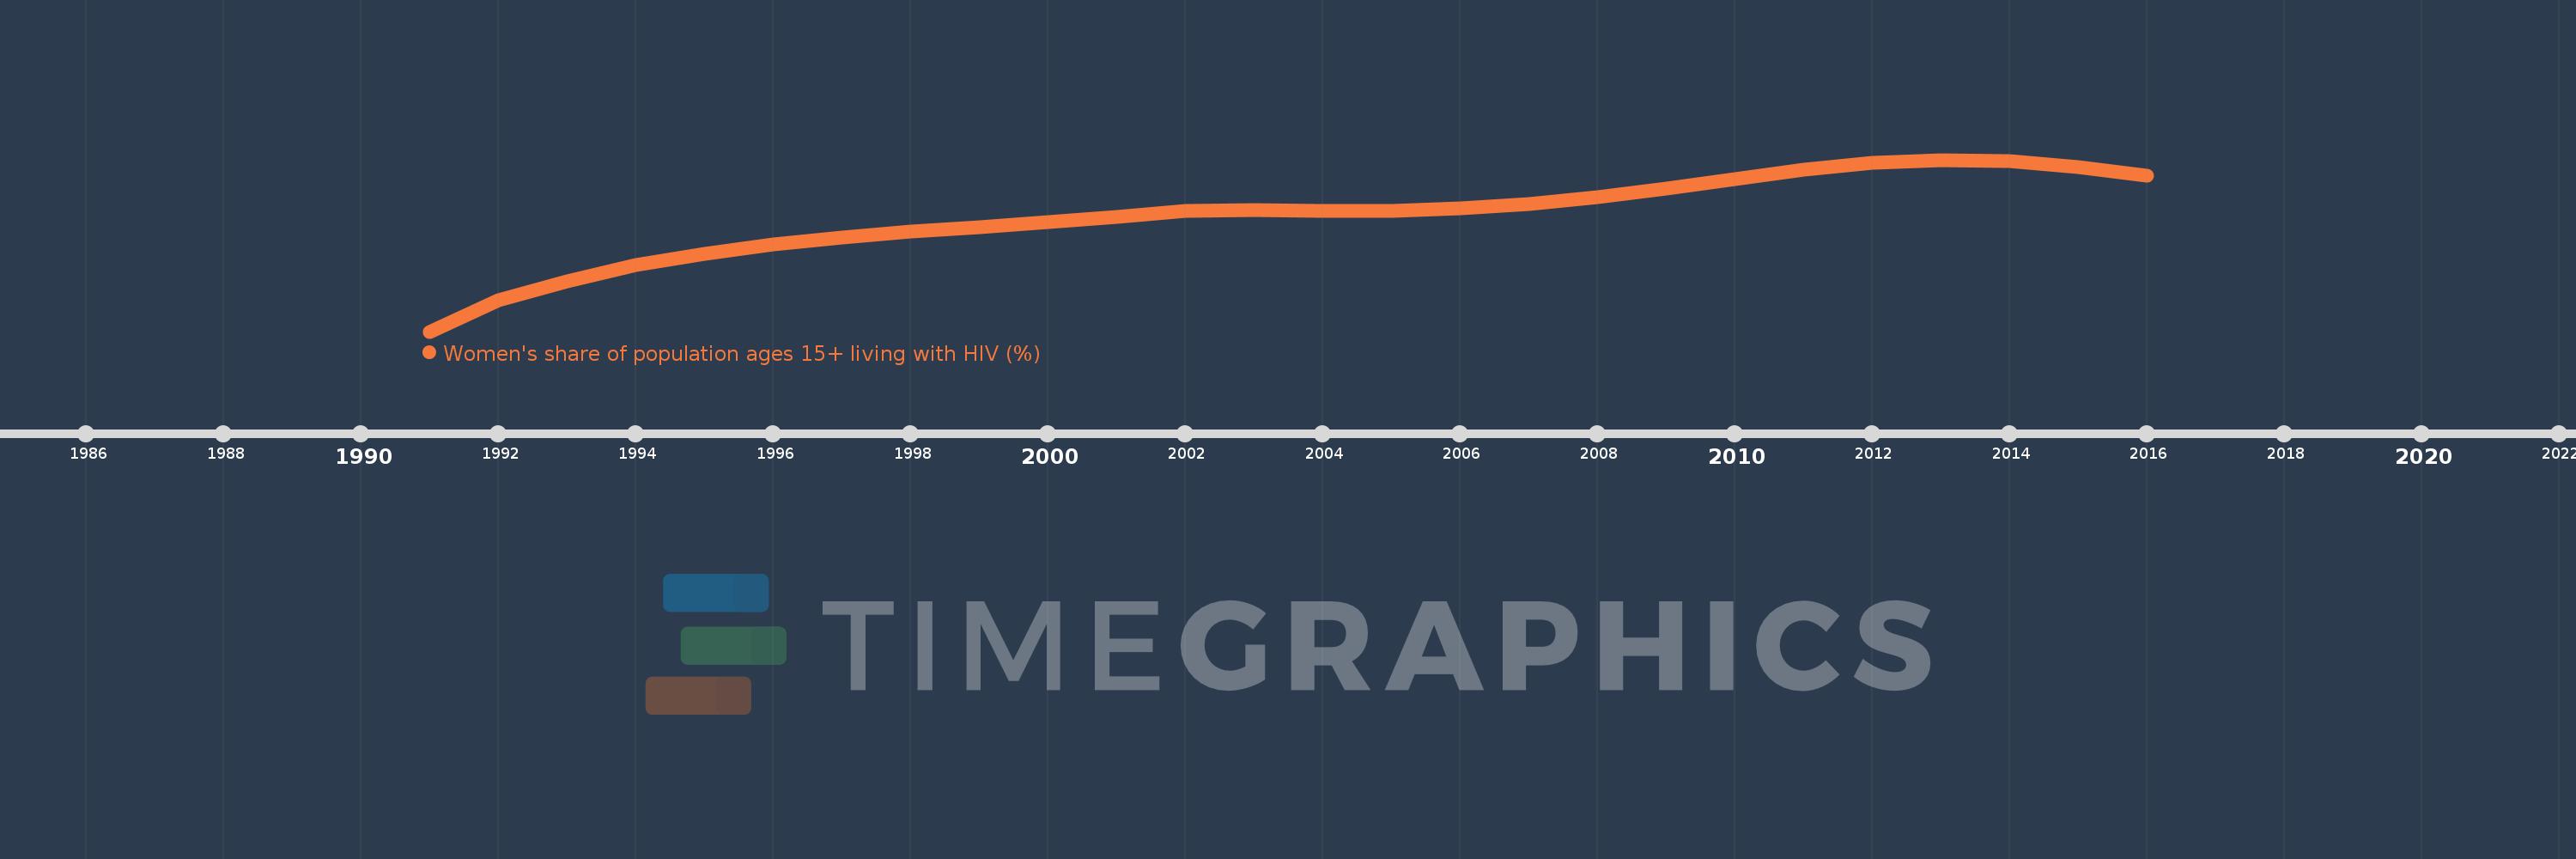
Women's share of population ages 15+ living with HIV (%)
2016,2015,2014,2013,2012,2011,2010,2009,2008,2007,2006,2005,2004,2003,2002,2001,2000,1999,1998,1997,1996,1995,1994,1993,1992,1991
This statistics in other country:
Timeline:
This timeline shows a graph from 1991 to 2016 of Cuba. No data until 1990. Number of actual observations by date: 26.
Source name:
World Development Indicators
Source organization:
UNAIDS estimates.
Categories, topics:
Health, Gender
Last updated:
apr 23, 2017
Indicators value changes by year
Minimum:
17.469
jan 1, 1991
At the date of observation
Value
Absolute change
Change from previous value
jan 1, 1991
17.469
+17.469
0.0%
jan 1, 1992
19.084
+1.615
9.25%
jan 1, 1993
20.079
+0.995
5.21%
jan 1, 1994
20.904
+0.825
4.11%
jan 1, 1995
21.484
+0.58
2.78%
jan 1, 1996
21.959
+0.475
2.21%
jan 1, 1997
22.328
+0.369
1.68%
jan 1, 1998
22.632
+0.304
1.36%
jan 1, 1999
22.873
+0.241
1.06%
jan 1, 2000
23.14
+0.267
1.17%
jan 1, 2001
23.382
+0.242
1.05%
jan 1, 2002
23.682
+0.3
1.28%
jan 1, 2003
23.748
+0.066
0.28%
jan 1, 2004
23.684
-0.065
-0.27%
jan 1, 2005
23.722
+0.038
0.16%
jan 1, 2006
23.83
+0.108
0.45%
jan 1, 2007
24.066
+0.237
0.99%
jan 1, 2008
24.412
+0.346
1.44%
jan 1, 2009
24.857
+0.445
1.82%
jan 1, 2010
25.334
+0.477
1.92%
jan 1, 2011
25.81
+0.476
1.88%
jan 1, 2012
26.165
+0.356
1.38%
jan 1, 2013
26.34
+0.175
0.67%
jan 1, 2014
26.289
-0.052
-0.2%
jan 1, 2015
25.98
-0.309
-1.17%
jan 1, 2016
25.536
-0.443
-1.71%
Ranking of countries by current statistics by years


Comments: