29
/
en
AIzaSyAYiBZKx7MnpbEhh9jyipgxe19OcubqV5w
April 1, 2024
83643
Belize
BLZ
true
2
1
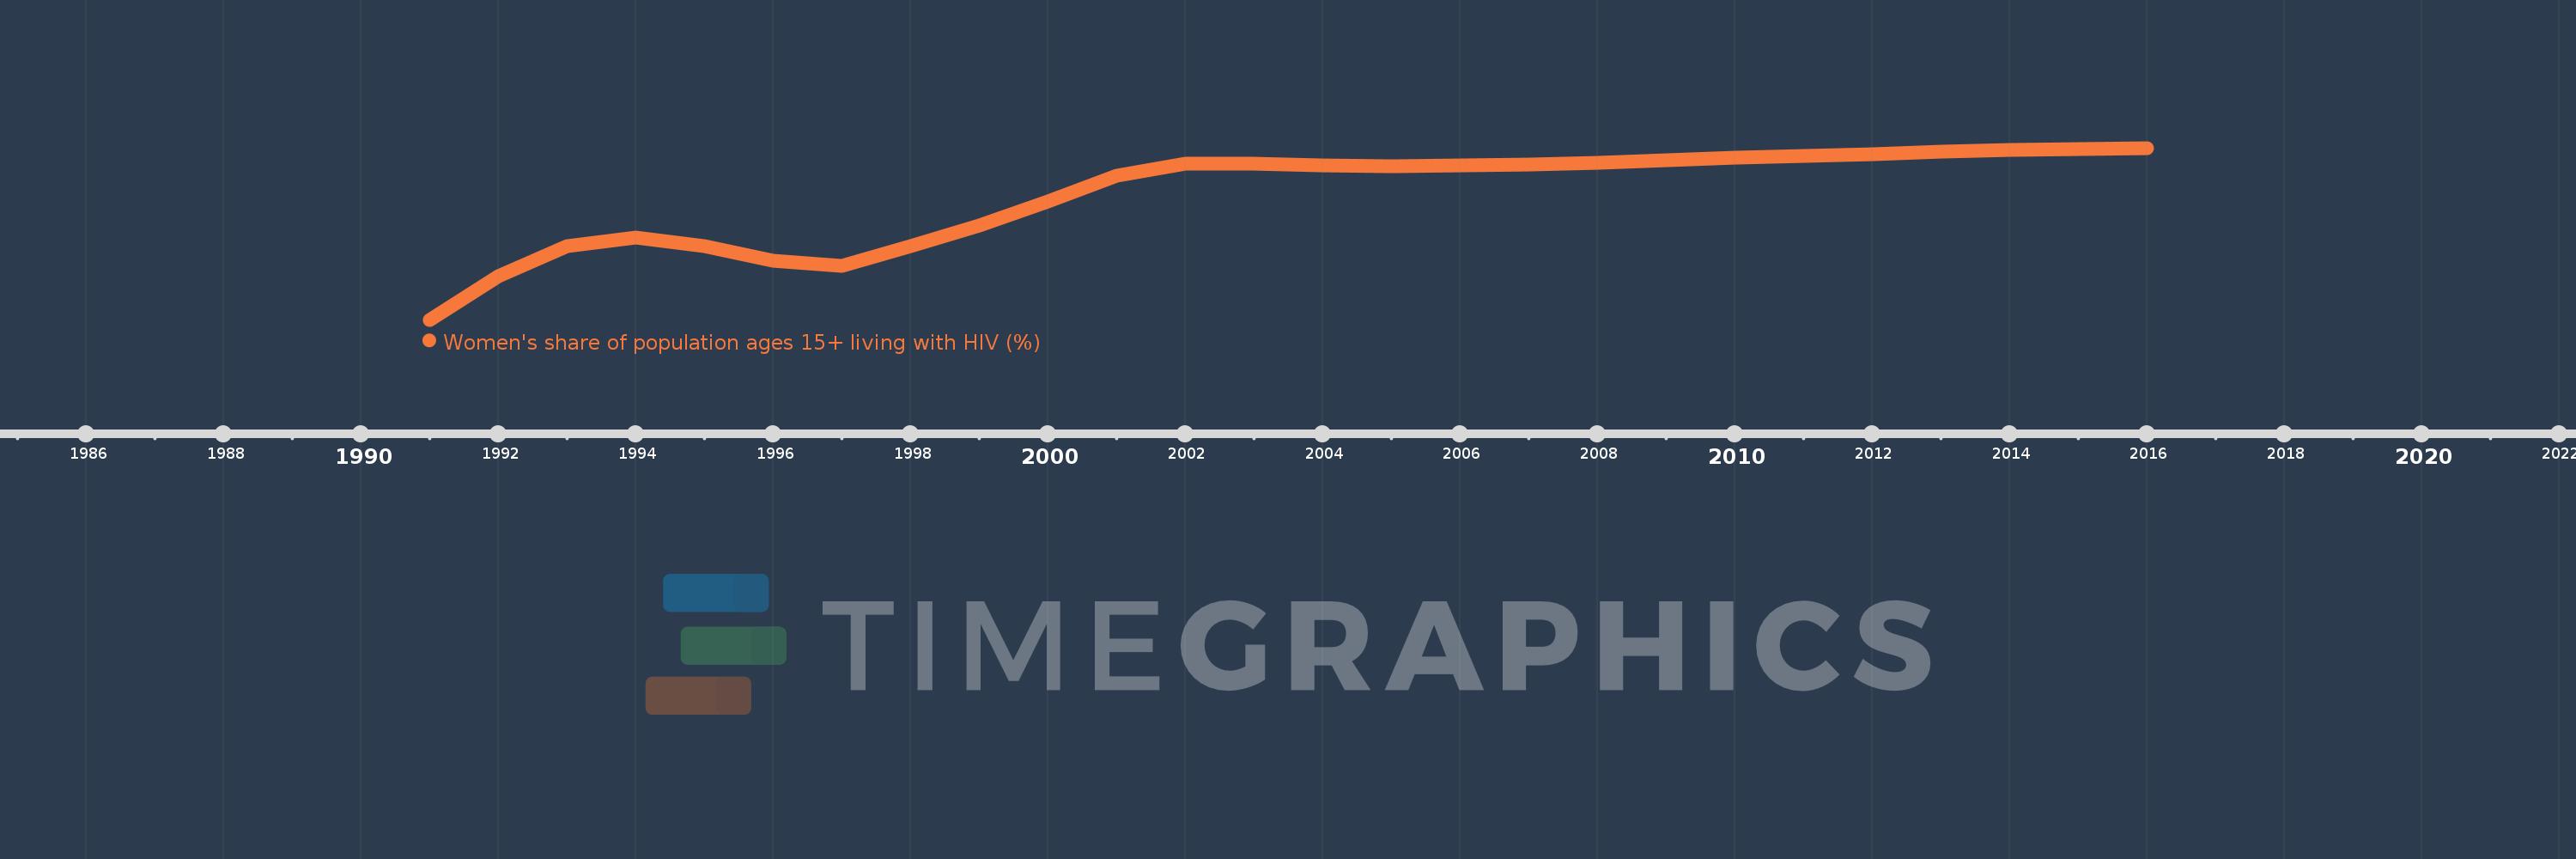
Women's share of population ages 15+ living with HIV (%)
2016,2015,2014,2013,2012,2011,2010,2009,2008,2007,2006,2005,2004,2003,2002,2001,2000,1999,1998,1997,1996,1995,1994,1993,1992,1991
This statistics in other country:
Timeline:
This timeline shows a graph from 1991 to 2016 of Belize. No data until 1990. Number of actual observations by date: 26.
Source name:
World Development Indicators
Source organization:
UNAIDS estimates.
Categories, topics:
Health, Gender
Last updated:
apr 23, 2017
Indicators value changes by year
Minimum:
35.135
jan 1, 1991
Maximum:
48.256
jan 1, 2016
At the date of observation
Value
Absolute change
Change from previous value
jan 1, 1991
35.135
+35.135
0.0%
jan 1, 1992
38.462
+3.326
9.47%
jan 1, 1993
40.789
+2.328
6.05%
jan 1, 1994
41.441
+0.652
1.6%
jan 1, 1995
40.741
-0.701
-1.69%
jan 1, 1996
39.662
-1.078
-2.65%
jan 1, 1997
39.255
-0.407
-1.03%
jan 1, 1998
40.784
+1.529
3.9%
jan 1, 1999
42.334
+1.549
3.8%
jan 1, 2000
44.168
+1.834
4.33%
jan 1, 2001
46.117
+1.948
4.41%
jan 1, 2002
47.028
+0.911
1.98%
jan 1, 2003
47.086
+0.058
0.12%
jan 1, 2004
46.952
-0.134
-0.28%
jan 1, 2005
46.882
-0.07
-0.15%
jan 1, 2006
46.931
+0.049
0.1%
jan 1, 2007
47.004
+0.072
0.15%
jan 1, 2008
47.108
+0.104
0.22%
jan 1, 2009
47.331
+0.224
0.47%
jan 1, 2010
47.54
+0.209
0.44%
jan 1, 2011
47.645
+0.105
0.22%
jan 1, 2012
47.803
+0.158
0.33%
jan 1, 2013
47.977
+0.174
0.36%
jan 1, 2014
48.084
+0.108
0.22%
jan 1, 2015
48.148
+0.064
0.13%
jan 1, 2016
48.256
+0.108
0.22%
Ranking of countries by current statistics by years


Comments: