29
/
en
AIzaSyAYiBZKx7MnpbEhh9jyipgxe19OcubqV5w
April 1, 2024
128999
Eritrea
ERI
true
2
1
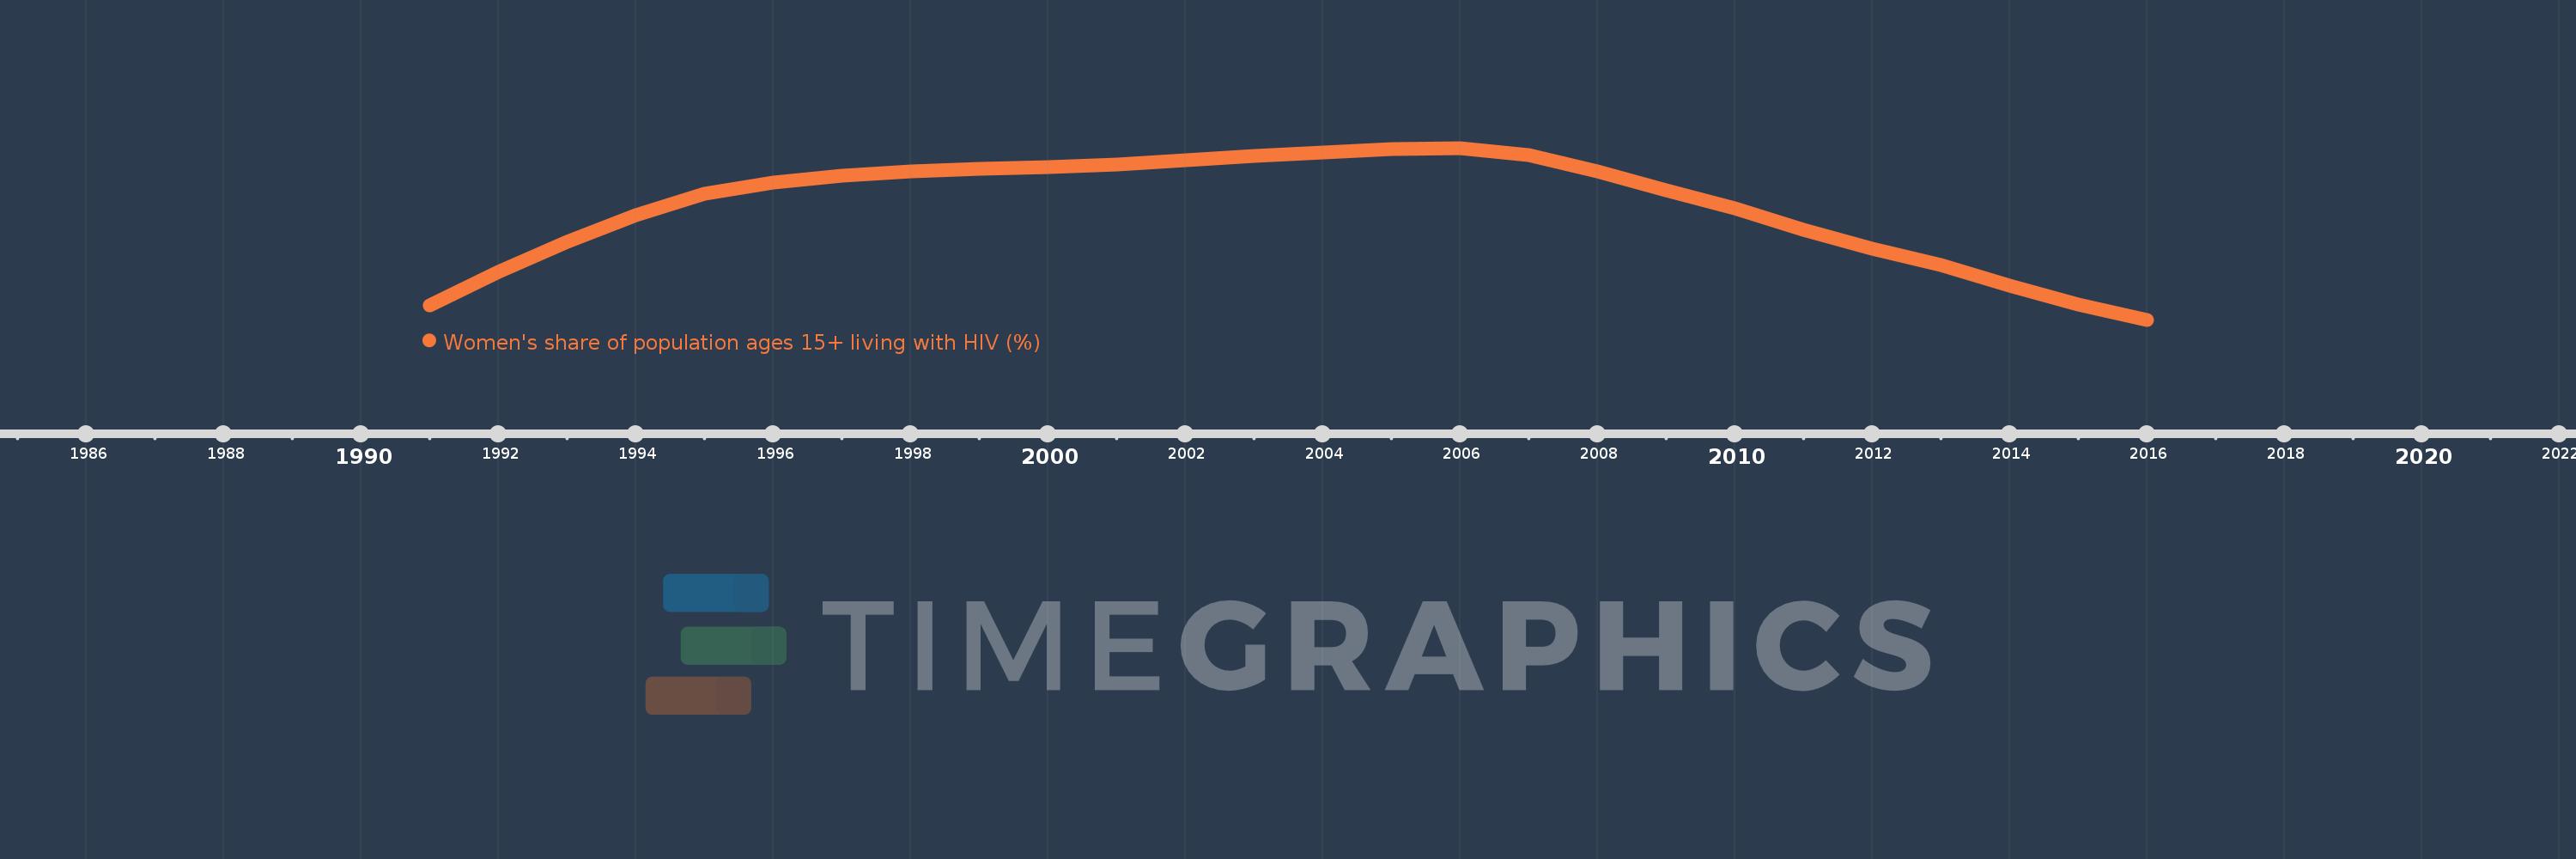
Women's share of population ages 15+ living with HIV (%)
2016,2015,2014,2013,2012,2011,2010,2009,2008,2007,2006,2005,2004,2003,2002,2001,2000,1999,1998,1997,1996,1995,1994,1993,1992,1991
This statistics in other country:
Timeline:
This timeline shows a graph from 1991 to 2016 of Eritrea. No data until 1990. Number of actual observations by date: 26.
Source name:
World Development Indicators
Source organization:
UNAIDS estimates.
Categories, topics:
Health, Gender
Last updated:
apr 23, 2017
Indicators value changes by year
Minimum:
64.339
jan 1, 2016
Maximum:
68.573
jan 1, 2006
At the date of observation
Value
Absolute change
Change from previous value
jan 1, 1991
64.694
+64.694
0.0%
jan 1, 1992
65.526
+0.832
1.29%
jan 1, 1993
66.263
+0.737
1.13%
jan 1, 1994
66.923
+0.66
1.0%
jan 1, 1995
67.447
+0.523
0.78%
jan 1, 1996
67.712
+0.265
0.39%
jan 1, 1997
67.891
+0.18
0.27%
jan 1, 1998
67.996
+0.104
0.15%
jan 1, 1999
68.056
+0.061
0.09%
jan 1, 2000
68.092
+0.036
0.05%
jan 1, 2001
68.174
+0.082
0.12%
jan 1, 2002
68.272
+0.098
0.14%
jan 1, 2003
68.37
+0.098
0.14%
jan 1, 2004
68.459
+0.088
0.13%
jan 1, 2005
68.536
+0.077
0.11%
jan 1, 2006
68.573
+0.037
0.05%
jan 1, 2007
68.407
-0.166
-0.24%
jan 1, 2008
67.985
-0.422
-0.62%
jan 1, 2009
67.539
-0.446
-0.66%
jan 1, 2010
67.077
-0.462
-0.68%
jan 1, 2011
66.565
-0.512
-0.76%
jan 1, 2012
66.092
-0.473
-0.71%
jan 1, 2013
65.678
-0.413
-0.63%
jan 1, 2014
65.18
-0.499
-0.76%
jan 1, 2015
64.713
-0.467
-0.72%
jan 1, 2016
64.339
-0.374
-0.58%
Ranking of countries by current statistics by years


Comments: