29
/
en
AIzaSyAYiBZKx7MnpbEhh9jyipgxe19OcubqV5w
April 1, 2024
202472
Morocco
MAR
true
2
1
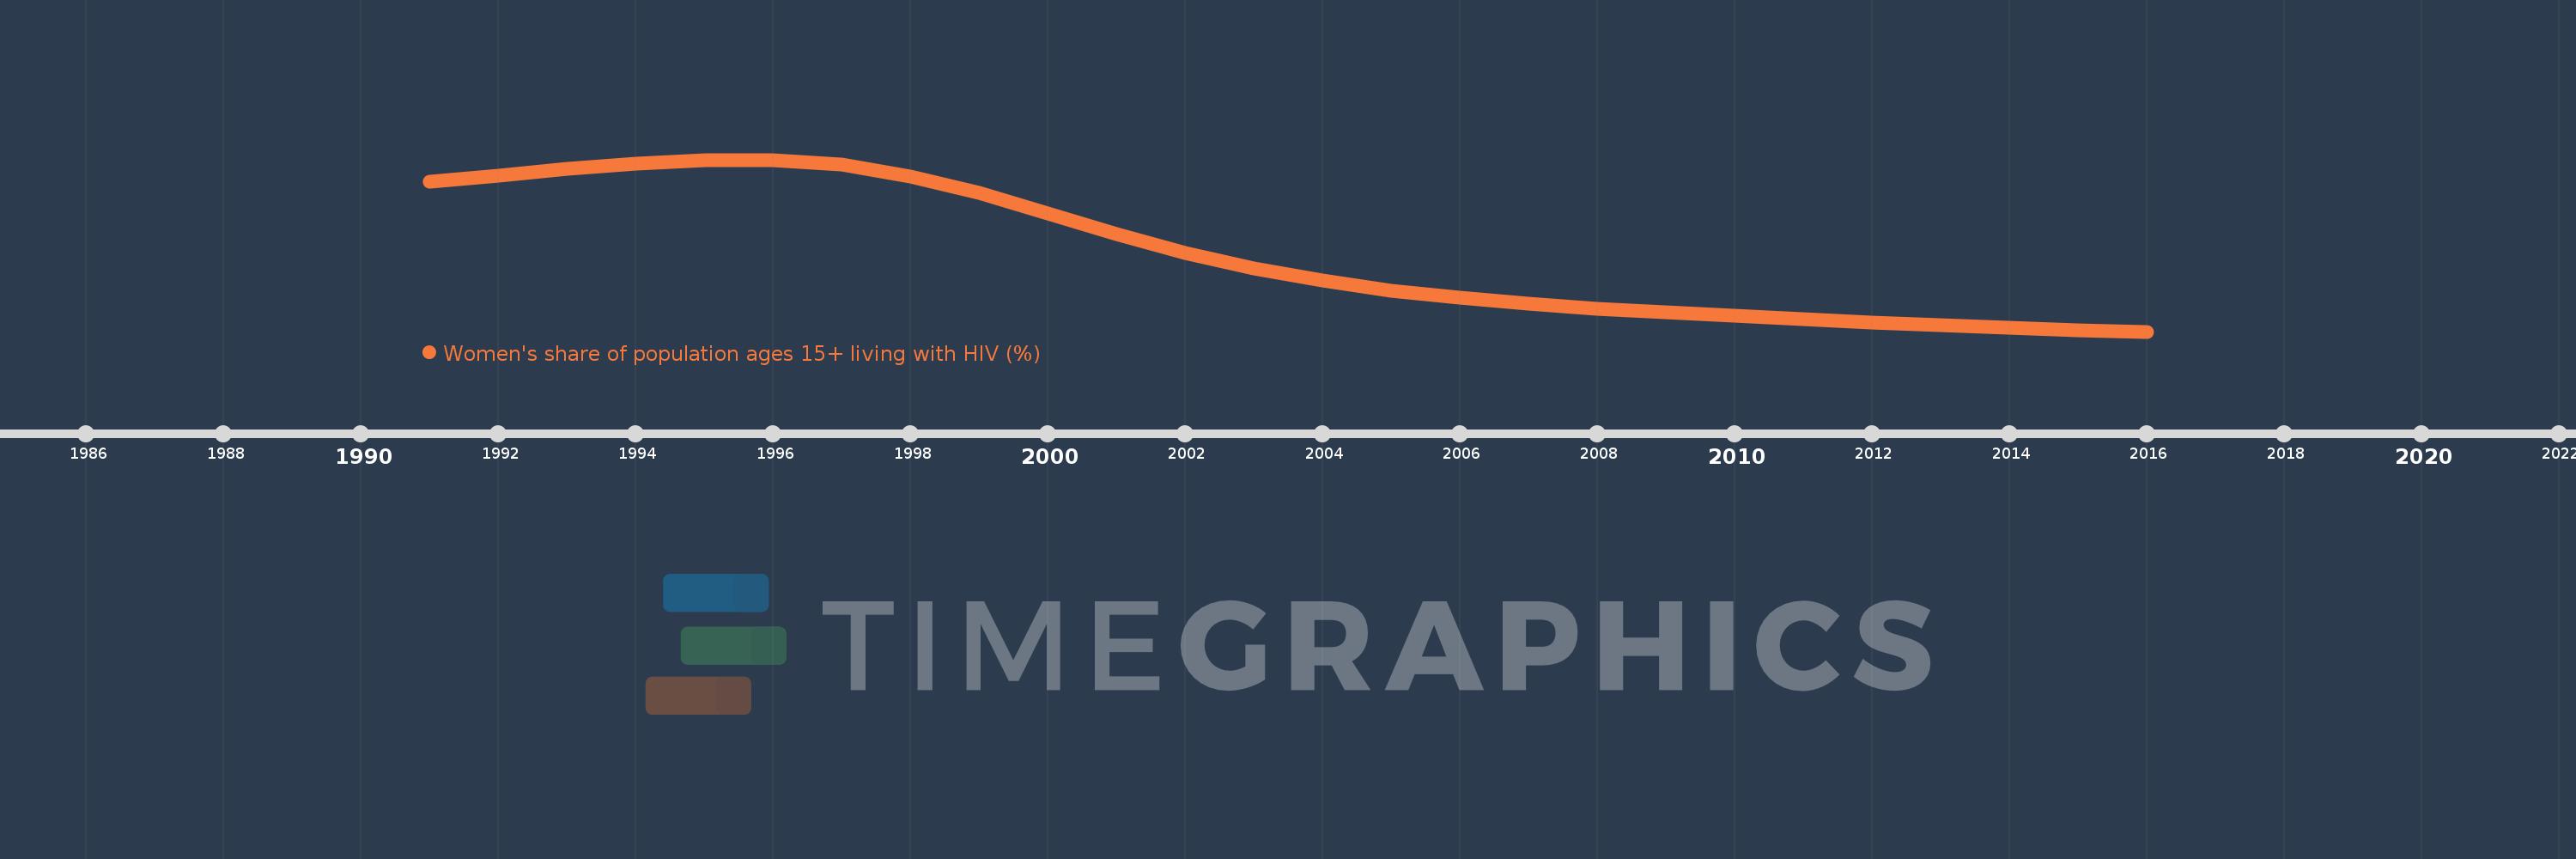
Women's share of population ages 15+ living with HIV (%)
2016,2015,2014,2013,2012,2011,2010,2009,2008,2007,2006,2005,2004,2003,2002,2001,2000,1999,1998,1997,1996,1995,1994,1993,1992,1991
This statistics in other country:
Timeline:
This timeline shows a graph from 1991 to 2016 of Morocco. No data until 1990. Number of actual observations by date: 26.
Source name:
World Development Indicators
Source organization:
UNAIDS estimates.
Categories, topics:
Health, Gender
Last updated:
apr 23, 2017
Indicators value changes by year
Minimum:
36.458
jan 1, 2016
Maximum:
64.784
jan 1, 1996
At the date of observation
Value
Absolute change
Change from previous value
jan 1, 1991
61.13
+61.13
0.0%
jan 1, 1992
62.164
+1.034
1.69%
jan 1, 1993
63.256
+1.092
1.76%
jan 1, 1994
64.194
+0.938
1.48%
jan 1, 1995
64.779
+0.586
0.91%
jan 1, 1996
64.784
+0.005
0.01%
jan 1, 1997
63.955
-0.83
-1.28%
jan 1, 1998
62.055
-1.899
-2.97%
jan 1, 1999
59.262
-2.793
-4.5%
jan 1, 2000
55.921
-3.341
-5.64%
jan 1, 2001
52.515
-3.406
-6.09%
jan 1, 2002
49.441
-3.074
-5.85%
jan 1, 2003
46.903
-2.538
-5.13%
jan 1, 2004
44.858
-2.045
-4.36%
jan 1, 2005
43.241
-1.617
-3.6%
jan 1, 2006
42.026
-1.215
-2.81%
jan 1, 2007
41.046
-0.981
-2.33%
jan 1, 2008
40.254
-0.792
-1.93%
jan 1, 2009
39.584
-0.67
-1.66%
jan 1, 2010
39.037
-0.547
-1.38%
jan 1, 2011
38.535
-0.502
-1.29%
jan 1, 2012
37.978
-0.556
-1.44%
jan 1, 2013
37.458
-0.52
-1.37%
jan 1, 2014
37.066
-0.391
-1.04%
jan 1, 2015
36.733
-0.334
-0.9%
jan 1, 2016
36.458
-0.275
-0.75%
Ranking of countries by current statistics by years


Comments: