29
/
en
AIzaSyAYiBZKx7MnpbEhh9jyipgxe19OcubqV5w
April 1, 2024
34705
Fragile and conflict affected situations
FCS
false
2
1
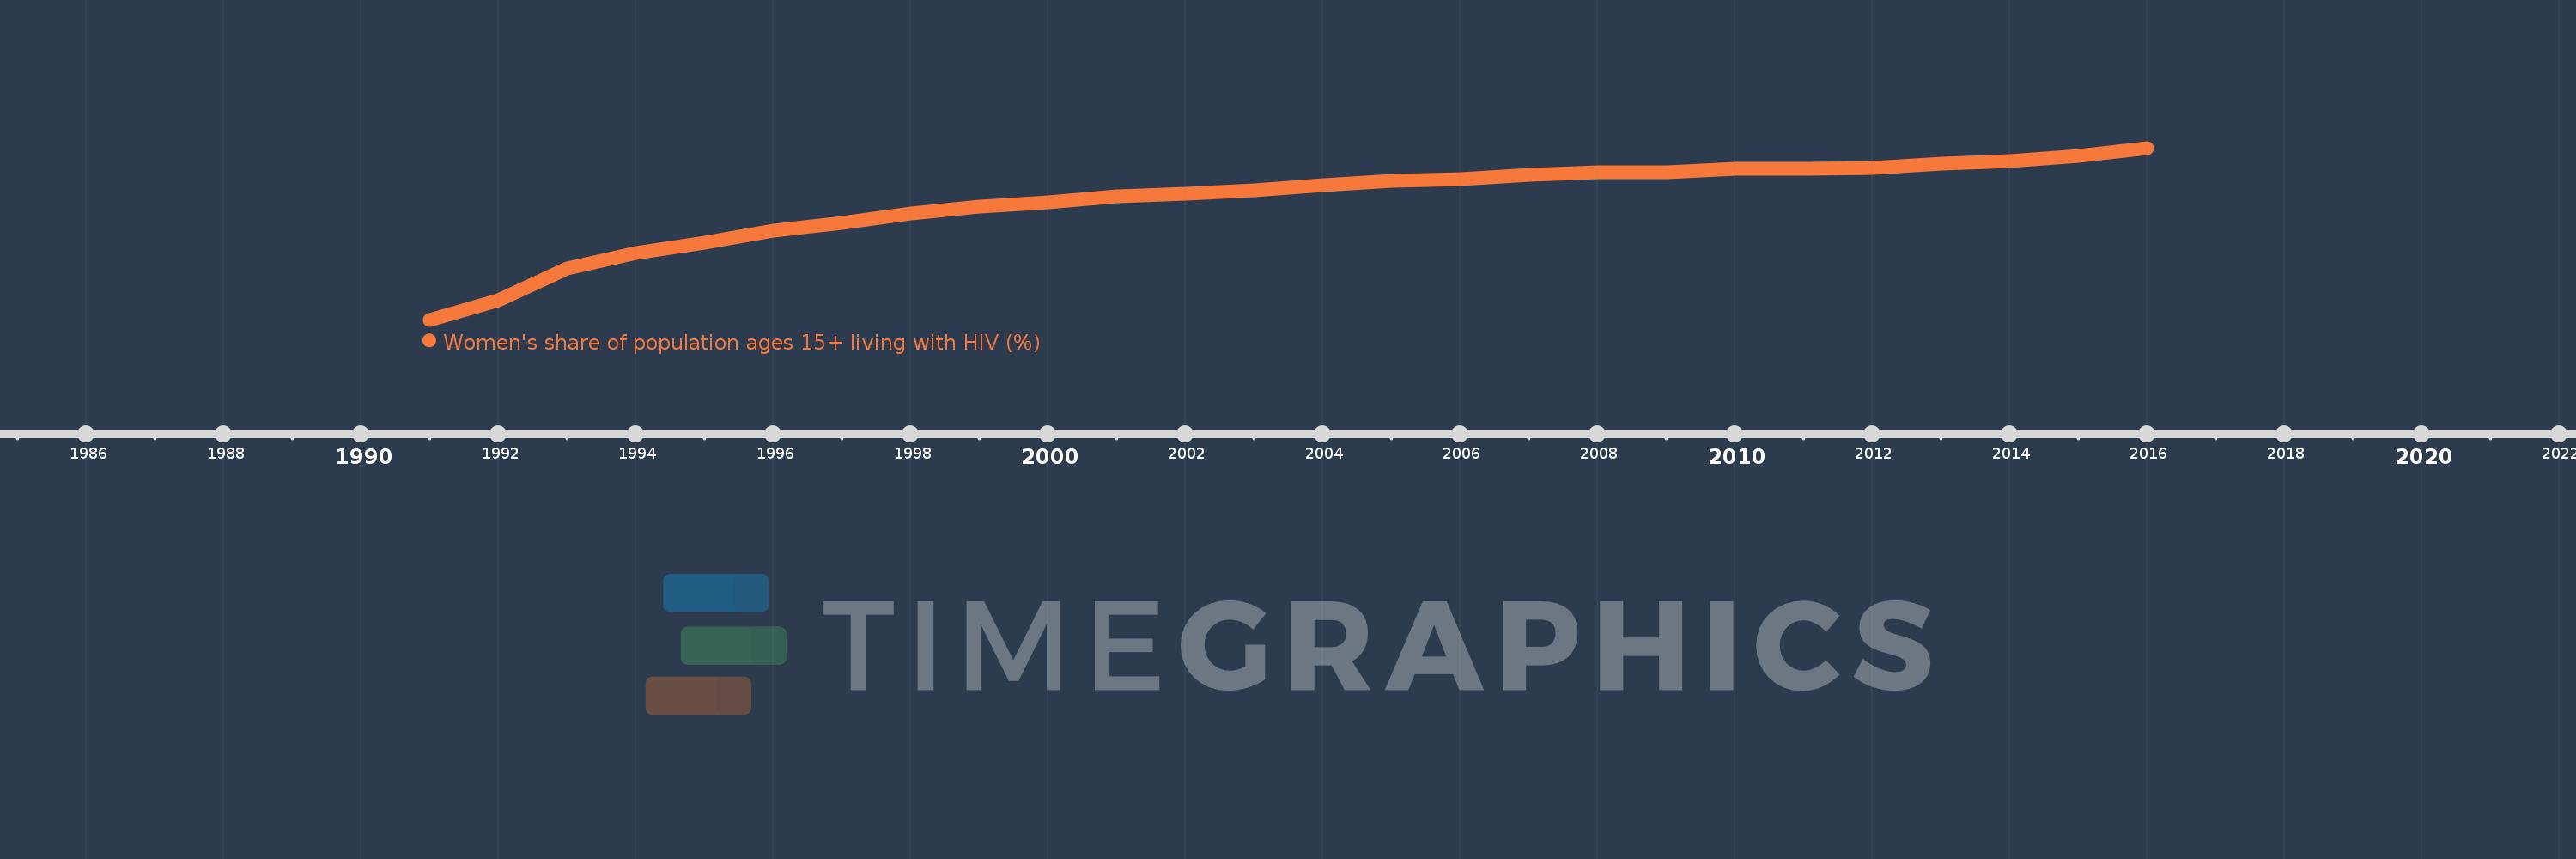
Women's share of population ages 15+ living with HIV (%)
2016,2015,2014,2013,2012,2011,2010,2009,2008,2007,2006,2005,2004,2003,2002,2001,2000,1999,1998,1997,1996,1995,1994,1993,1992,1991
This statistics in other country:
Timeline:
This timeline shows a graph from 1991 to 2016 of Fragile and conflict affected situations. No data until 1990. Number of actual observations by date: 26.
Source name:
World Development Indicators
Source organization:
UNAIDS estimates.
Categories, topics:
Health, Gender
Last updated:
apr 23, 2017
Indicators value changes by year
Minimum:
50.293
jan 1, 1991
Maximum:
55.645
jan 1, 2016
At the date of observation
Value
Absolute change
Change from previous value
jan 1, 1991
50.293
+50.293
0.0%
jan 1, 1992
50.895
+0.602
1.2%
jan 1, 1993
51.881
+0.986
1.94%
jan 1, 1994
52.359
+0.478
0.92%
jan 1, 1995
52.684
+0.326
0.62%
jan 1, 1996
53.069
+0.385
0.73%
jan 1, 1997
53.319
+0.25
0.47%
jan 1, 1998
53.611
+0.291
0.55%
jan 1, 1999
53.823
+0.212
0.4%
jan 1, 2000
53.95
+0.127
0.24%
jan 1, 2001
54.13
+0.179
0.33%
jan 1, 2002
54.23
+0.101
0.19%
jan 1, 2003
54.332
+0.101
0.19%
jan 1, 2004
54.478
+0.146
0.27%
jan 1, 2005
54.632
+0.154
0.28%
jan 1, 2006
54.68
+0.048
0.09%
jan 1, 2007
54.815
+0.134
0.25%
jan 1, 2008
54.876
+0.061
0.11%
jan 1, 2009
54.891
+0.015
0.03%
jan 1, 2010
54.989
+0.098
0.18%
jan 1, 2011
54.998
+0.01
0.02%
jan 1, 2012
55.013
+0.015
0.03%
jan 1, 2013
55.143
+0.13
0.24%
jan 1, 2014
55.23
+0.087
0.16%
jan 1, 2015
55.409
+0.179
0.32%
jan 1, 2016
55.645
+0.236
0.43%
Ranking of countries by current statistics by years


Comments: