29
/
en
AIzaSyAYiBZKx7MnpbEhh9jyipgxe19OcubqV5w
April 1, 2024
137552
Gambia, The
GMB
true
2
1
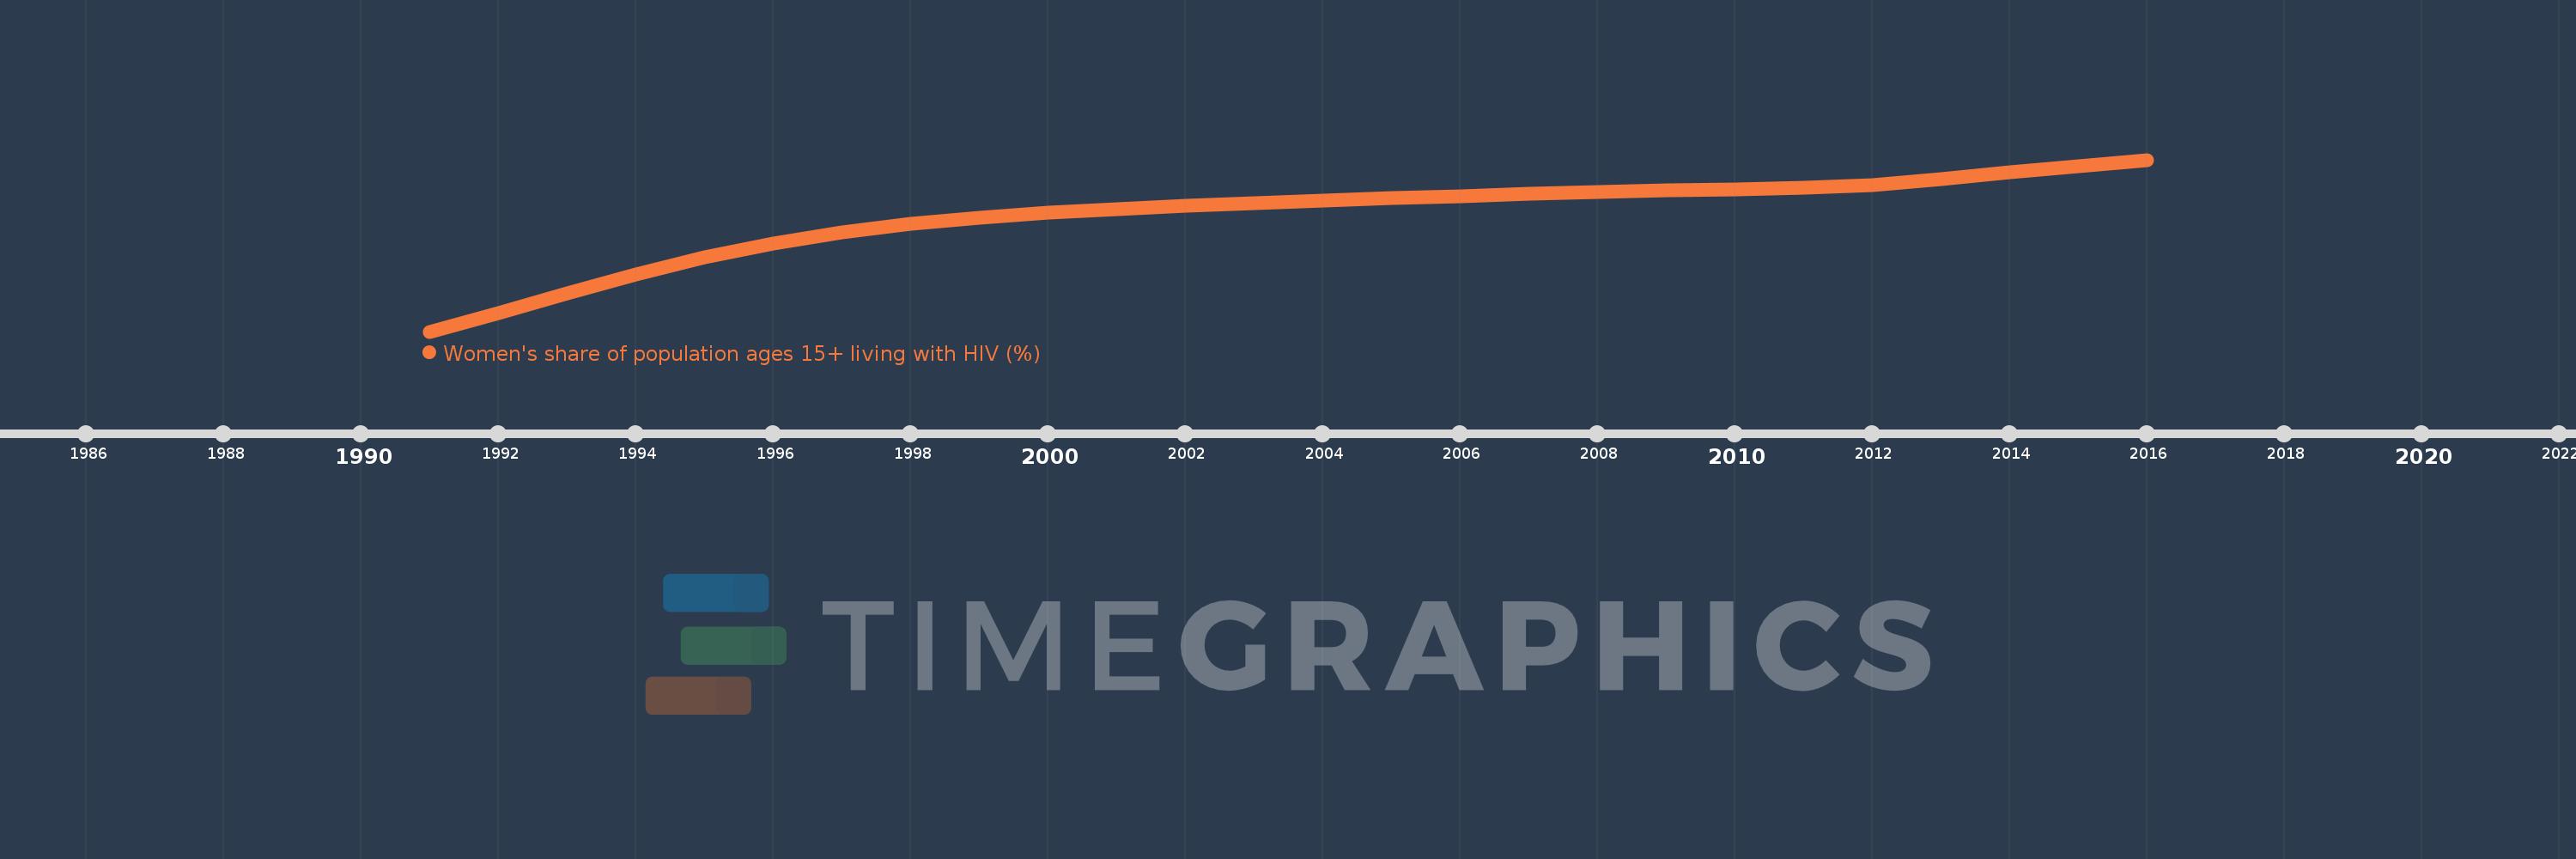
Women's share of population ages 15+ living with HIV (%)
2016,2015,2014,2013,2012,2011,2010,2009,2008,2007,2006,2005,2004,2003,2002,2001,2000,1999,1998,1997,1996,1995,1994,1993,1992,1991
This statistics in other country:
Timeline:
This timeline shows a graph from 1991 to 2016 of Gambia, The. No data until 1990. Number of actual observations by date: 26.
Source name:
World Development Indicators
Source organization:
UNAIDS estimates.
Categories, topics:
Health, Gender
Last updated:
apr 23, 2017
Indicators value changes by year
Minimum:
52.532
jan 1, 1991
Maximum:
61.279
jan 1, 2016
At the date of observation
Value
Absolute change
Change from previous value
jan 1, 1991
52.532
+52.532
0.0%
jan 1, 1992
53.48
+0.949
1.81%
jan 1, 1993
54.487
+1.007
1.88%
jan 1, 1994
55.452
+0.964
1.77%
jan 1, 1995
56.314
+0.863
1.56%
jan 1, 1996
56.995
+0.681
1.21%
jan 1, 1997
57.562
+0.567
0.99%
jan 1, 1998
57.999
+0.437
0.76%
jan 1, 1999
58.324
+0.325
0.56%
jan 1, 2000
58.582
+0.258
0.44%
jan 1, 2001
58.778
+0.196
0.33%
jan 1, 2002
58.939
+0.161
0.27%
jan 1, 2003
59.077
+0.137
0.23%
jan 1, 2004
59.209
+0.133
0.22%
jan 1, 2005
59.323
+0.113
0.19%
jan 1, 2006
59.436
+0.113
0.19%
jan 1, 2007
59.539
+0.103
0.17%
jan 1, 2008
59.628
+0.089
0.15%
jan 1, 2009
59.711
+0.083
0.14%
jan 1, 2010
59.79
+0.079
0.13%
jan 1, 2011
59.864
+0.074
0.12%
jan 1, 2012
59.972
+0.108
0.18%
jan 1, 2013
60.289
+0.317
0.53%
jan 1, 2014
60.652
+0.363
0.6%
jan 1, 2015
60.967
+0.315
0.52%
jan 1, 2016
61.279
+0.312
0.51%
Ranking of countries by current statistics by years


Comments: