29
/
en
AIzaSyAYiBZKx7MnpbEhh9jyipgxe19OcubqV5w
April 1, 2024
60503
Sub-Saharan Africa (excluding high income)
SSA
false
2
1
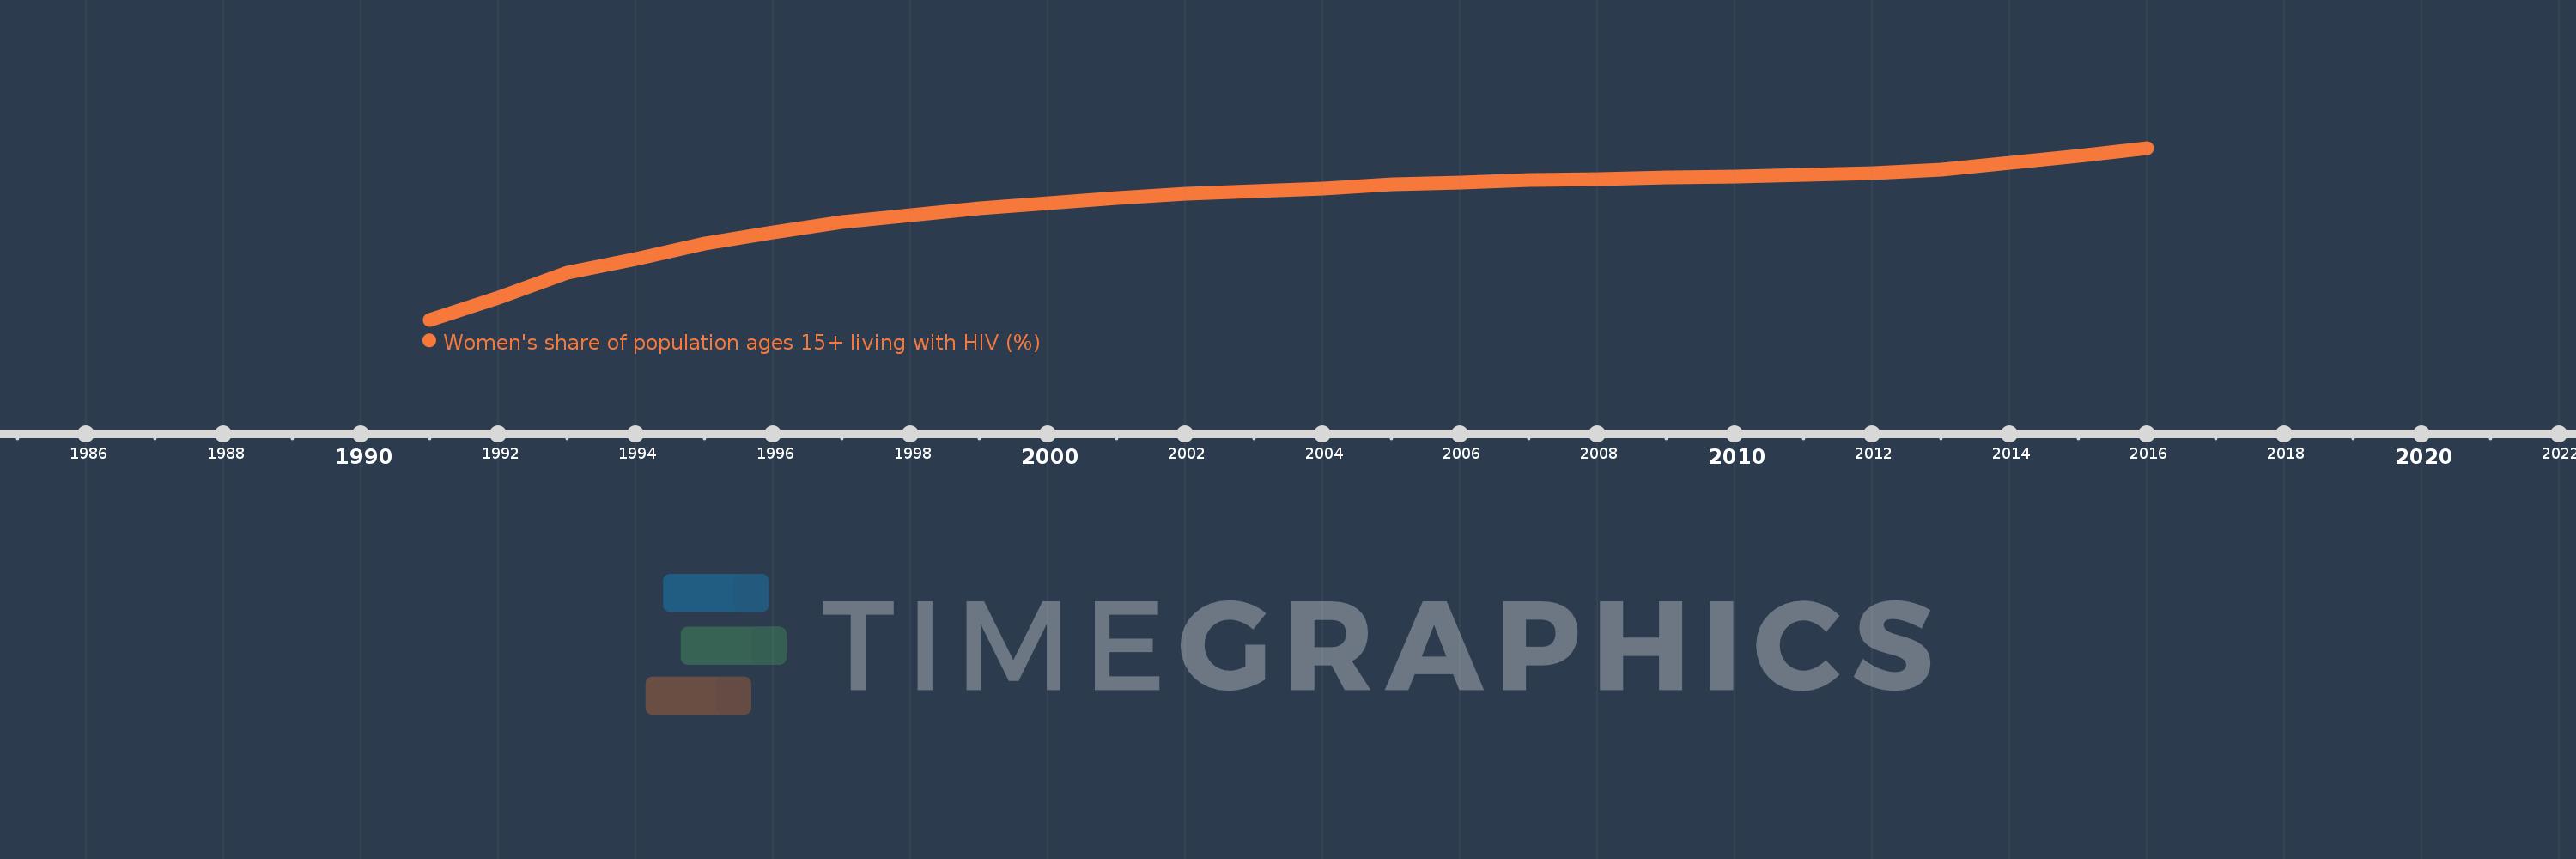
Women's share of population ages 15+ living with HIV (%)
2016,2015,2014,2013,2012,2011,2010,2009,2008,2007,2006,2005,2004,2003,2002,2001,2000,1999,1998,1997,1996,1995,1994,1993,1992,1991
This statistics in other country:
Timeline:
This timeline shows a graph from 1991 to 2016 of Sub-Saharan Africa (excluding high income). No data until 1990. Number of actual observations by date: 26.
Source name:
World Development Indicators
Source organization:
UNAIDS estimates.
Categories, topics:
Health, Gender
Last updated:
apr 23, 2017
Indicators value changes by year
Minimum:
53.196
jan 1, 1991
Maximum:
58.369
jan 1, 2016
At the date of observation
Value
Absolute change
Change from previous value
jan 1, 1991
53.196
+53.196
0.0%
jan 1, 1992
53.871
+0.675
1.27%
jan 1, 1993
54.609
+0.738
1.37%
jan 1, 1994
55.022
+0.413
0.76%
jan 1, 1995
55.482
+0.46
0.84%
jan 1, 1996
55.815
+0.333
0.6%
jan 1, 1997
56.125
+0.31
0.56%
jan 1, 1998
56.35
+0.225
0.4%
jan 1, 1999
56.563
+0.214
0.38%
jan 1, 2000
56.716
+0.153
0.27%
jan 1, 2001
56.866
+0.15
0.26%
jan 1, 2002
56.98
+0.113
0.2%
jan 1, 2003
57.072
+0.093
0.16%
jan 1, 2004
57.156
+0.084
0.15%
jan 1, 2005
57.272
+0.116
0.2%
jan 1, 2006
57.333
+0.061
0.11%
jan 1, 2007
57.403
+0.07
0.12%
jan 1, 2008
57.443
+0.041
0.07%
jan 1, 2009
57.469
+0.026
0.04%
jan 1, 2010
57.518
+0.049
0.09%
jan 1, 2011
57.558
+0.039
0.07%
jan 1, 2012
57.621
+0.063
0.11%
jan 1, 2013
57.722
+0.101
0.18%
jan 1, 2014
57.911
+0.188
0.33%
jan 1, 2015
58.129
+0.218
0.38%
jan 1, 2016
58.369
+0.241
0.41%
Ranking of countries by current statistics by years


Comments: