29
/
en
AIzaSyAYiBZKx7MnpbEhh9jyipgxe19OcubqV5w
April 1, 2024
179690
Liberia
LBR
true
2
1
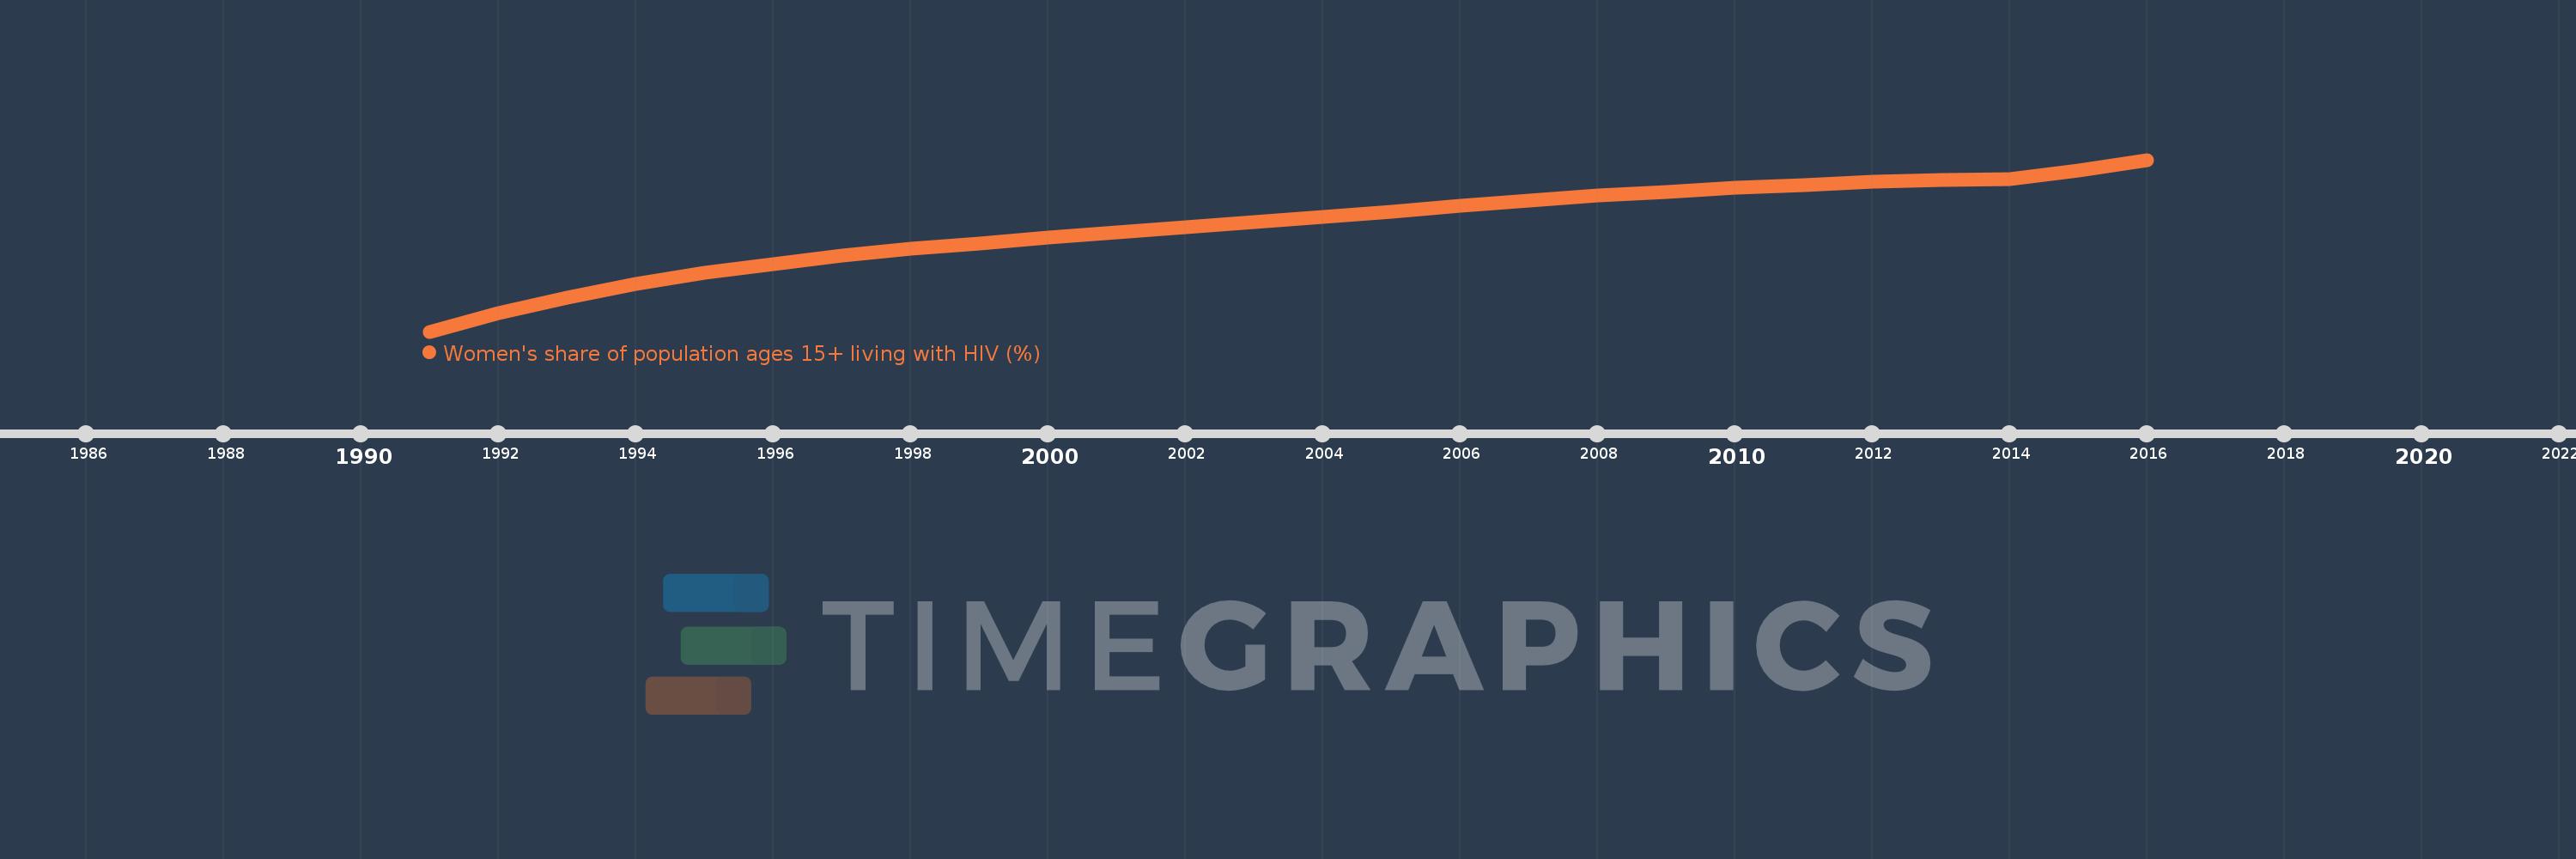
Women's share of population ages 15+ living with HIV (%)
2016,2015,2014,2013,2012,2011,2010,2009,2008,2007,2006,2005,2004,2003,2002,2001,2000,1999,1998,1997,1996,1995,1994,1993,1992,1991
This statistics in other country:
Timeline:
This timeline shows a graph from 1991 to 2016 of Liberia. No data until 1990. Number of actual observations by date: 26.
Source name:
World Development Indicators
Source organization:
UNAIDS estimates.
Categories, topics:
Health, Gender
Last updated:
apr 23, 2017
Indicators value changes by year
Minimum:
54.533
jan 1, 1991
Maximum:
60.156
jan 1, 2016
At the date of observation
Value
Absolute change
Change from previous value
jan 1, 1991
54.533
+54.533
0.0%
jan 1, 1992
55.142
+0.608
1.12%
jan 1, 1993
55.646
+0.505
0.92%
jan 1, 1994
56.092
+0.445
0.8%
jan 1, 1995
56.448
+0.357
0.64%
jan 1, 1996
56.744
+0.296
0.52%
jan 1, 1997
57.014
+0.27
0.48%
jan 1, 1998
57.235
+0.221
0.39%
jan 1, 1999
57.424
+0.188
0.33%
jan 1, 2000
57.601
+0.178
0.31%
jan 1, 2001
57.773
+0.171
0.3%
jan 1, 2002
57.942
+0.169
0.29%
jan 1, 2003
58.115
+0.173
0.3%
jan 1, 2004
58.288
+0.173
0.3%
jan 1, 2005
58.469
+0.181
0.31%
jan 1, 2006
58.648
+0.178
0.3%
jan 1, 2007
58.823
+0.176
0.3%
jan 1, 2008
58.978
+0.155
0.26%
jan 1, 2009
59.113
+0.135
0.23%
jan 1, 2010
59.23
+0.117
0.2%
jan 1, 2011
59.331
+0.1
0.17%
jan 1, 2012
59.431
+0.101
0.17%
jan 1, 2013
59.486
+0.055
0.09%
jan 1, 2014
59.53
+0.044
0.07%
jan 1, 2015
59.816
+0.286
0.48%
jan 1, 2016
60.156
+0.34
0.57%
Ranking of countries by current statistics by years


Comments: