29
/
en
AIzaSyAYiBZKx7MnpbEhh9jyipgxe19OcubqV5w
April 1, 2024
39657
IDA only
IDX
false
2
1
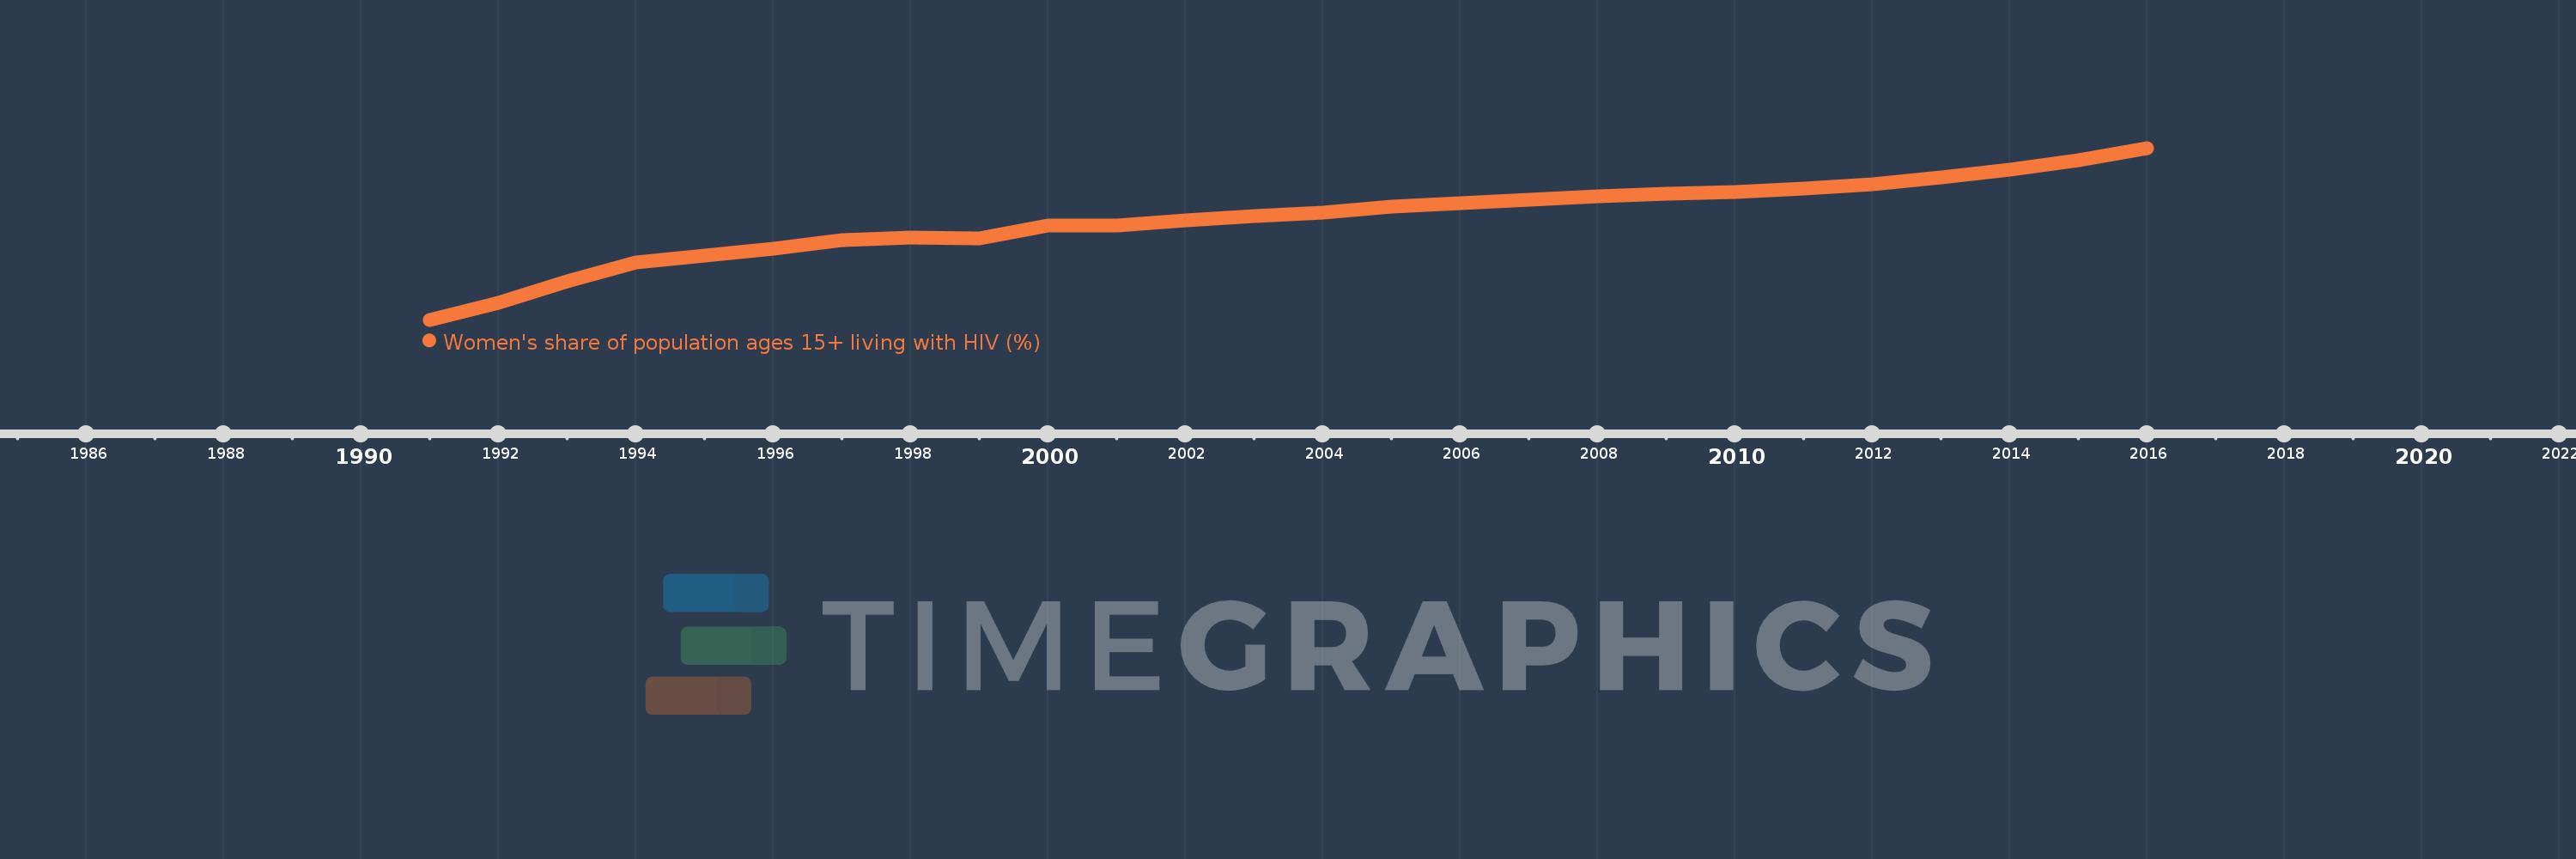
Women's share of population ages 15+ living with HIV (%)
2016,2015,2014,2013,2012,2011,2010,2009,2008,2007,2006,2005,2004,2003,2002,2001,2000,1999,1998,1997,1996,1995,1994,1993,1992,1991
This statistics in other country:
Timeline:
This timeline shows a graph from 1991 to 2016 of IDA only. No data until 1990. Number of actual observations by date: 26.
Source name:
World Development Indicators
Source organization:
UNAIDS estimates.
Categories, topics:
Health, Gender
Last updated:
apr 23, 2017
Indicators value changes by year
Minimum:
50.832
jan 1, 1991
Maximum:
55.065
jan 1, 2016
At the date of observation
Value
Absolute change
Change from previous value
jan 1, 1991
50.832
+50.832
0.0%
jan 1, 1992
51.242
+0.411
0.81%
jan 1, 1993
51.785
+0.543
1.06%
jan 1, 1994
52.251
+0.465
0.9%
jan 1, 1995
52.421
+0.171
0.33%
jan 1, 1996
52.581
+0.16
0.3%
jan 1, 1997
52.795
+0.214
0.41%
jan 1, 1998
52.852
+0.058
0.11%
jan 1, 1999
52.842
-0.01
-0.02%
jan 1, 2000
53.156
+0.314
0.59%
jan 1, 2001
53.164
+0.008
0.01%
jan 1, 2002
53.277
+0.113
0.21%
jan 1, 2003
53.384
+0.107
0.2%
jan 1, 2004
53.476
+0.092
0.17%
jan 1, 2005
53.622
+0.146
0.27%
jan 1, 2006
53.697
+0.075
0.14%
jan 1, 2007
53.795
+0.098
0.18%
jan 1, 2008
53.879
+0.084
0.16%
jan 1, 2009
53.931
+0.052
0.1%
jan 1, 2010
53.98
+0.049
0.09%
jan 1, 2011
54.07
+0.09
0.17%
jan 1, 2012
54.167
+0.097
0.18%
jan 1, 2013
54.334
+0.166
0.31%
jan 1, 2014
54.539
+0.205
0.38%
jan 1, 2015
54.758
+0.219
0.4%
jan 1, 2016
55.065
+0.307
0.56%
Ranking of countries by current statistics by years


Comments: