29
/
en
AIzaSyAYiBZKx7MnpbEhh9jyipgxe19OcubqV5w
April 1, 2024
274469
Ukraine
UKR
true
2
1
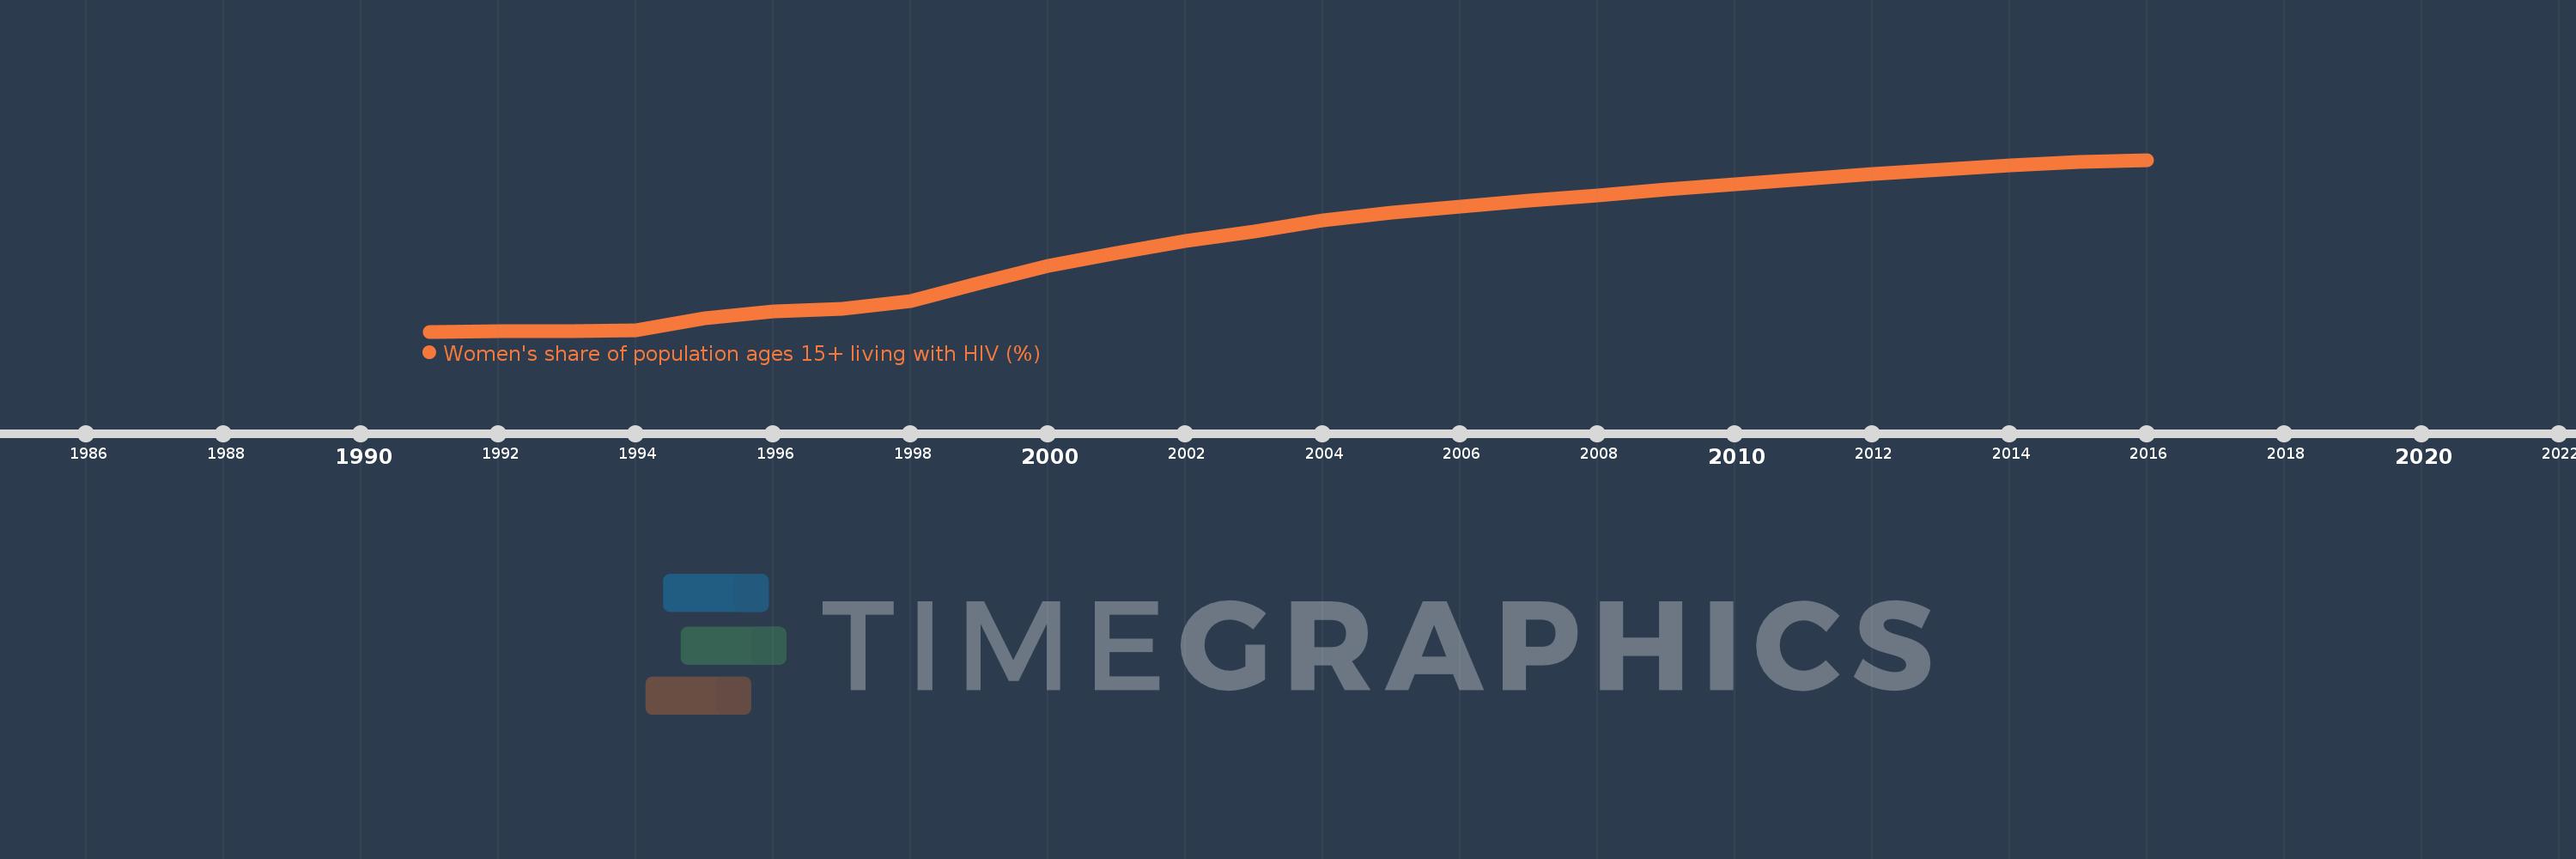
Women's share of population ages 15+ living with HIV (%)
2016,2015,2014,2013,2012,2011,2010,2009,2008,2007,2006,2005,2004,2003,2002,2001,2000,1999,1998,1997,1996,1995,1994,1993,1992,1991
This statistics in other country:
Timeline:
This timeline shows a graph from 1991 to 2016 of Ukraine. No data until 1990. Number of actual observations by date: 26.
Source name:
World Development Indicators
Source organization:
UNAIDS estimates.
Categories, topics:
Health, Gender
Last updated:
apr 23, 2017
Indicators value changes by year
Minimum:
20.595
jan 1, 1991
Maximum:
44.637
jan 1, 2016
At the date of observation
Value
Absolute change
Change from previous value
jan 1, 1991
20.595
+20.595
0.0%
jan 1, 1992
20.65
+0.056
0.27%
jan 1, 1993
20.694
+0.044
0.21%
jan 1, 1994
20.725
+0.03
0.15%
jan 1, 1995
22.418
+1.693
8.17%
jan 1, 1996
23.418
+1.001
4.46%
jan 1, 1997
23.788
+0.369
1.58%
jan 1, 1998
24.883
+1.095
4.6%
jan 1, 1999
27.413
+2.53
10.17%
jan 1, 2000
29.805
+2.392
8.73%
jan 1, 2001
31.622
+1.817
6.1%
jan 1, 2002
33.219
+1.597
5.05%
jan 1, 2003
34.638
+1.418
4.27%
jan 1, 2004
36.139
+1.501
4.33%
jan 1, 2005
37.229
+1.09
3.02%
jan 1, 2006
38.122
+0.893
2.4%
jan 1, 2007
38.899
+0.776
2.04%
jan 1, 2008
39.698
+0.799
2.05%
jan 1, 2009
40.475
+0.777
1.96%
jan 1, 2010
41.224
+0.75
1.85%
jan 1, 2011
41.886
+0.662
1.6%
jan 1, 2012
42.605
+0.719
1.72%
jan 1, 2013
43.252
+0.648
1.52%
jan 1, 2014
43.819
+0.567
1.31%
jan 1, 2015
44.298
+0.479
1.09%
jan 1, 2016
44.637
+0.339
0.77%
Ranking of countries by current statistics by years


Comments: