29
/
en
AIzaSyAYiBZKx7MnpbEhh9jyipgxe19OcubqV5w
April 1, 2024
278416
Uruguay
URY
true
2
1
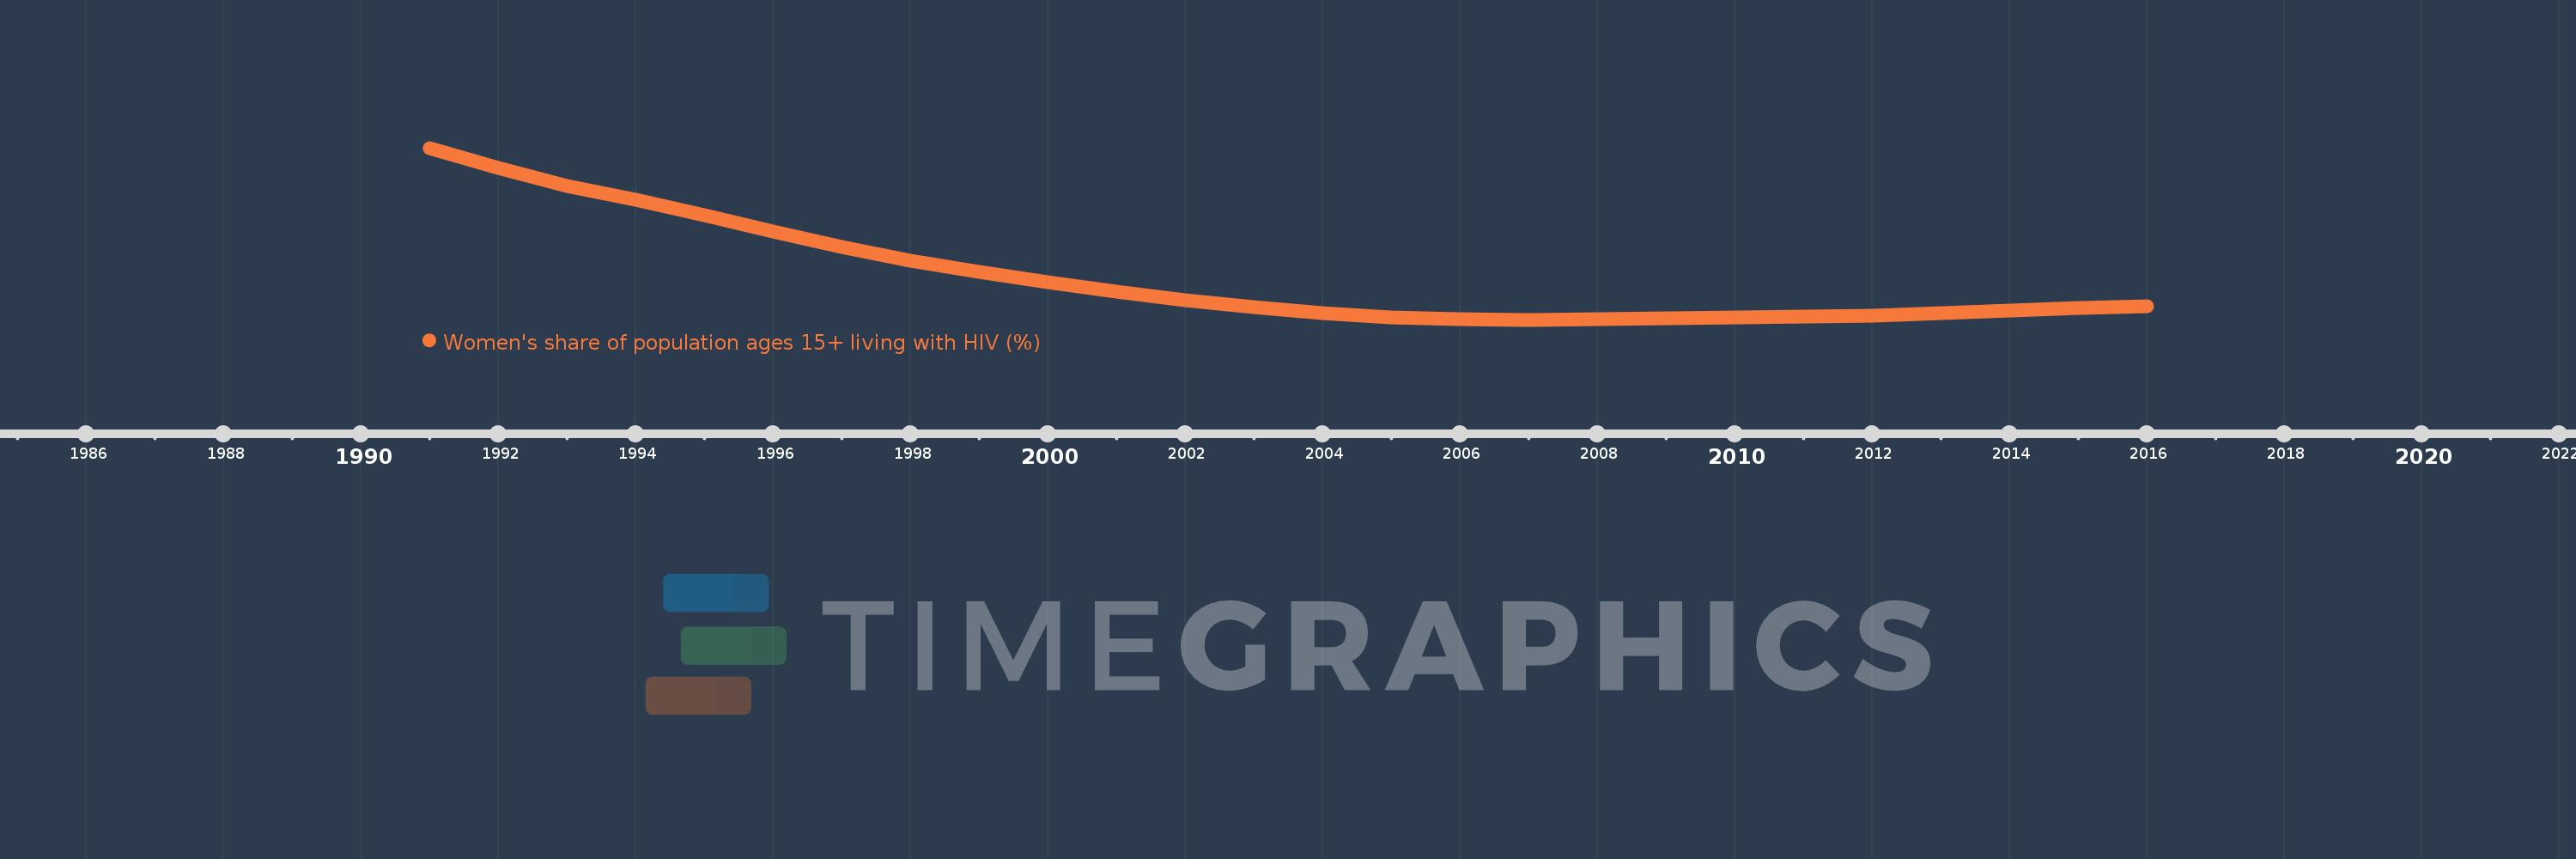
Women's share of population ages 15+ living with HIV (%)
2016,2015,2014,2013,2012,2011,2010,2009,2008,2007,2006,2005,2004,2003,2002,2001,2000,1999,1998,1997,1996,1995,1994,1993,1992,1991
This statistics in other country:
Timeline:
This timeline shows a graph from 1991 to 2016 of Uruguay. No data until 1990. Number of actual observations by date: 26.
Source name:
World Development Indicators
Source organization:
UNAIDS estimates.
Categories, topics:
Health, Gender
Last updated:
apr 23, 2017
Indicators value changes by year
Minimum:
23.892
jan 1, 2007
Maximum:
42.604
jan 1, 1991
At the date of observation
Value
Absolute change
Change from previous value
jan 1, 1991
42.604
+42.604
0.0%
jan 1, 1992
40.417
-2.186
-5.13%
jan 1, 1993
38.438
-1.98
-4.9%
jan 1, 1994
36.951
-1.486
-3.87%
jan 1, 1995
35.307
-1.645
-4.45%
jan 1, 1996
33.493
-1.814
-5.14%
jan 1, 1997
31.813
-1.68
-5.02%
jan 1, 1998
30.28
-1.533
-4.82%
jan 1, 1999
29.082
-1.198
-3.96%
jan 1, 2000
27.98
-1.102
-3.79%
jan 1, 2001
26.971
-1.01
-3.61%
jan 1, 2002
26.026
-0.945
-3.5%
jan 1, 2003
25.239
-0.787
-3.02%
jan 1, 2004
24.618
-0.621
-2.46%
jan 1, 2005
24.146
-0.472
-1.92%
jan 1, 2006
23.926
-0.219
-0.91%
jan 1, 2007
23.892
-0.034
-0.14%
jan 1, 2008
23.921
+0.029
0.12%
jan 1, 2009
24.03
+0.109
0.46%
jan 1, 2010
24.181
+0.151
0.63%
jan 1, 2011
24.268
+0.087
0.36%
jan 1, 2012
24.333
+0.065
0.27%
jan 1, 2013
24.648
+0.315
1.3%
jan 1, 2014
24.909
+0.261
1.06%
jan 1, 2015
25.19
+0.282
1.13%
jan 1, 2016
25.383
+0.193
0.77%
Ranking of countries by current statistics by years


Comments: