29
/
en
AIzaSyAYiBZKx7MnpbEhh9jyipgxe19OcubqV5w
April 1, 2024
231898
Rwanda
RWA
true
2
1
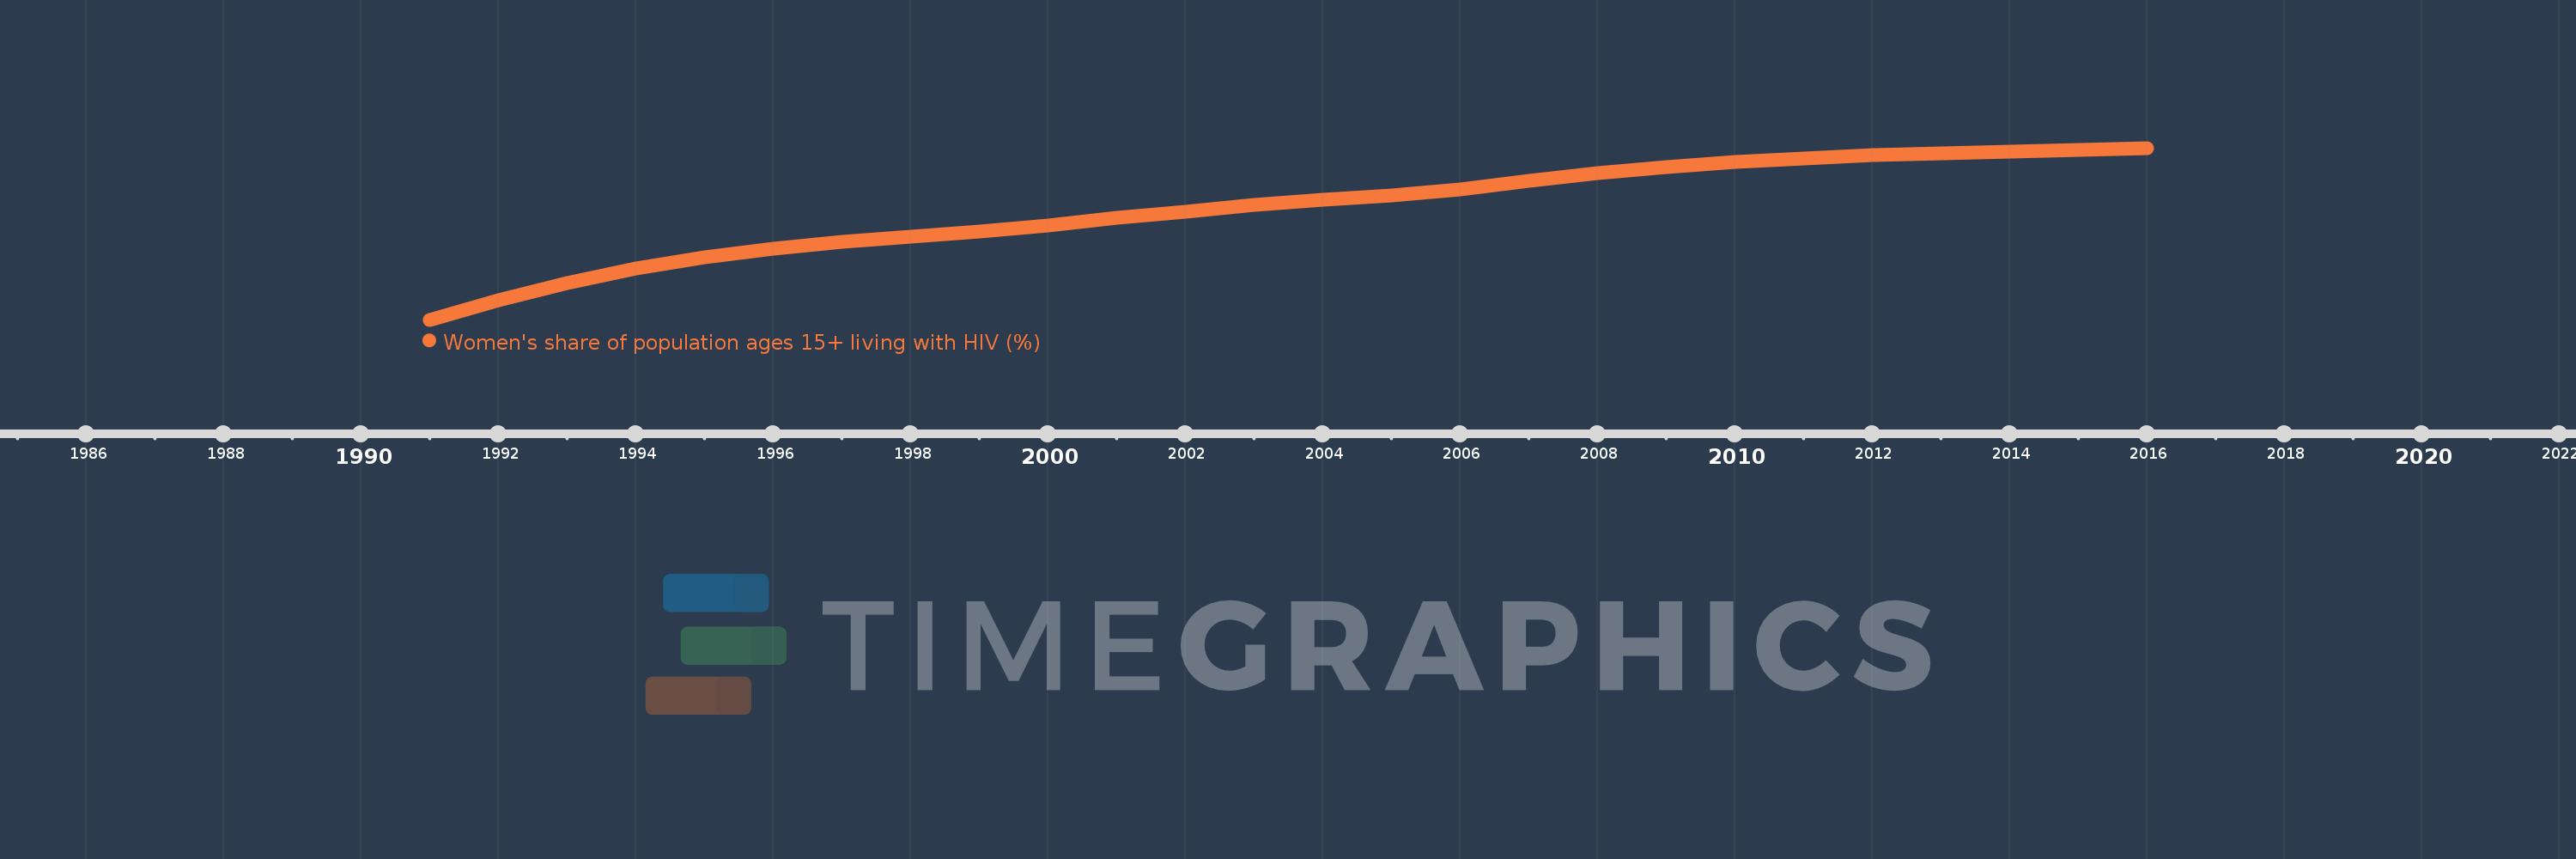
Women's share of population ages 15+ living with HIV (%)
2016,2015,2014,2013,2012,2011,2010,2009,2008,2007,2006,2005,2004,2003,2002,2001,2000,1999,1998,1997,1996,1995,1994,1993,1992,1991
This statistics in other country:
Timeline:
This timeline shows a graph from 1991 to 2016 of Rwanda. No data until 1990. Number of actual observations by date: 26.
Source name:
World Development Indicators
Source organization:
UNAIDS estimates.
Categories, topics:
Health, Gender
Last updated:
apr 23, 2017
Indicators value changes by year
Minimum:
53.462
jan 1, 1991
At the date of observation
Value
Absolute change
Change from previous value
jan 1, 1991
53.462
+53.462
0.0%
jan 1, 1992
54.251
+0.789
1.48%
jan 1, 1993
54.927
+0.676
1.25%
jan 1, 1994
55.495
+0.568
1.03%
jan 1, 1995
55.949
+0.454
0.82%
jan 1, 1996
56.274
+0.325
0.58%
jan 1, 1997
56.545
+0.271
0.48%
jan 1, 1998
56.762
+0.217
0.38%
jan 1, 1999
56.978
+0.216
0.38%
jan 1, 2000
57.212
+0.234
0.41%
jan 1, 2001
57.499
+0.287
0.5%
jan 1, 2002
57.757
+0.258
0.45%
jan 1, 2003
58.006
+0.248
0.43%
jan 1, 2004
58.219
+0.213
0.37%
jan 1, 2005
58.409
+0.19
0.33%
jan 1, 2006
58.63
+0.221
0.38%
jan 1, 2007
58.962
+0.332
0.57%
jan 1, 2008
59.276
+0.314
0.53%
jan 1, 2009
59.518
+0.242
0.41%
jan 1, 2010
59.71
+0.192
0.32%
jan 1, 2011
59.854
+0.144
0.24%
jan 1, 2012
59.981
+0.127
0.21%
jan 1, 2013
60.066
+0.085
0.14%
jan 1, 2014
60.135
+0.069
0.12%
jan 1, 2015
60.204
+0.068
0.11%
jan 1, 2016
60.28
+0.076
0.13%
Ranking of countries by current statistics by years


Comments: